At a Glance
- Breakthrough T1D’s FY25 revenue was a record high of $300 million, up 14% from the prior year.
- The revenue increase was fueled by $68 million in one-time gifts for Project ACT (Accelerate Cell Therapies), a cure-based initiative.
- The increase in revenue is no surprise, as a cure is the long-held priority of the T1D community, and drives donors to give more.
- Rising revenue and donor support raise expectations for tangible cure progress.
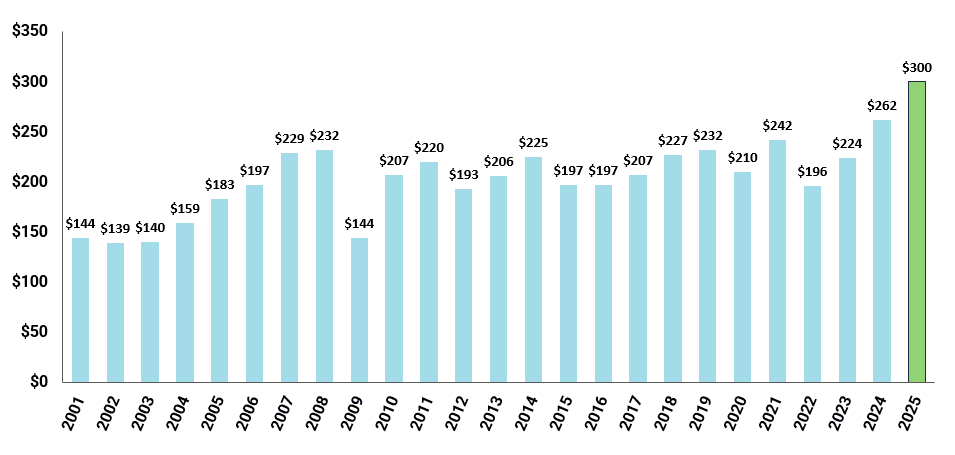
Breakthrough T1D, a leading T1D-focused nonprofit, set a record-high revenue in the last fiscal year (July 1, 2024 – June 30, 2025). At $300 million, this is the highest earning year since JDCA began tracking this information in 2001.
This report provides an in-depth look into the core drivers of revenue growth, based on the fiscal year 2025 (FY25) consolidated financial statements. It also lays out the implications and expectations that accompany this gain. Delivering a real breakthrough cure with speed is expected in return for those dollars.
A major driver of this record revenue is successful fundraising for Project ACT (Accelerate Cell Therapies). ACT raised $68 million in FY25. This success is not surprising and is consistent with JDCA value surveys. The T1D community prioritizes cure research above all else, and ACT is seen as a commitment to the cure. But to ensure this is more than a marketing and fundraising program, that $68 windfall now needs to show real-world results. In the weeks ahead, JDCA will review how program spending and grant allocation are fulfilling this promise.
Record Revenue
Chart A: Breakthrough T1D Historical Revenue ($ Millions)
This revenue is what fuels the organization’s activities. It pays for research grants, advocacy, educational programs, salaries, and overhead. In a separate report, we will review in depth how the money was used for these activities.
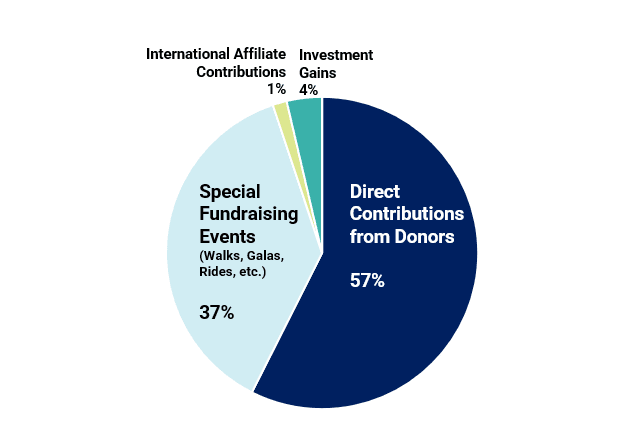
Revenue is derived from multiple sources, including direct contributions from individual donors, proceeds from special events like walks and galas, investment gains, and payments from international affiliates. Historically and in FY25, the two largest revenue drivers are direct contributions and special events. Combined, these two sources of revenue accounted for 94% of revenue in FY25 (see chart B).
Chart B: FY25 Revenue Sources as a Percentage
Contributions: Up 61%
Contributions are direct or promised donations from individuals or organizations. At $172 million in FY25, this was the largest revenue source, up 61% from the prior year. The gain is largely attributed to Breakthrough T1D receiving $68 million in one-time gifts to support Project ACT, a strategic initiative to cure T1D. Breakthrough T1D describes these gifts as “transformational."
In FY24, Breakthrough T1D launched Project ACT with substantial fanfare as a major strategic platform, led directly by CEO Aaron Kowalski. After the launch of the initiative, JDCA asked whether the program was more of a marketing initiative to raise money or a true, fundamental strategic platform. It has clearly been a fundraising success. We have yet to see if it will be a cure breakthrough success.
Project ACT is interpreted by the community as a pathway to a cure. It comes as no surprise that the initiative’s launch garnered such increased donor support and enthusiasm. Throughout fifteen years of fielding the annual Values and Priorities survey, the donor community has left no ambiguity; a cure is the priority, and if nonprofits followed donor wishes, they would see overwhelming support.
Special Fundraising Events: Up 6%
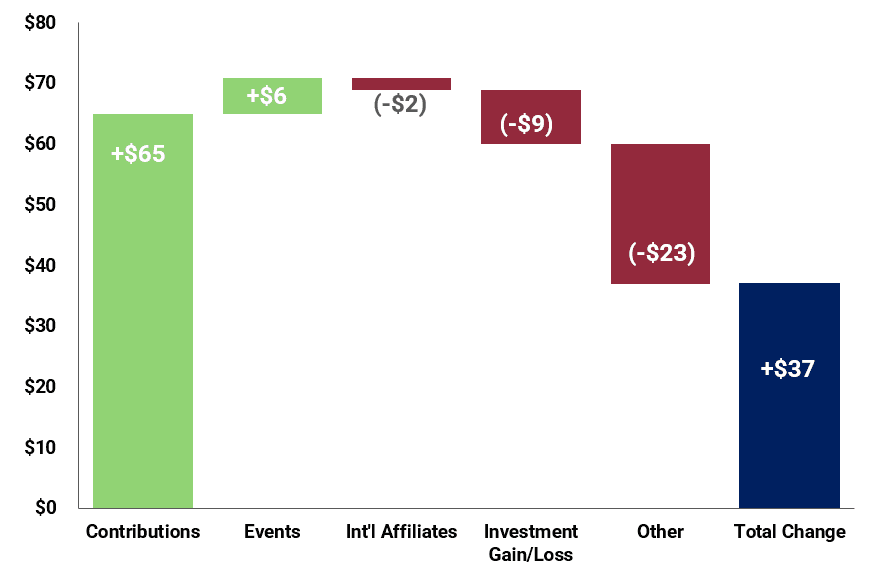
Special events are funds gathered from fundraising walks, rides, galas, and the like. At $112 million, this revenue source is the second-largest contributor, an increase of $6 million from FY24 (see chart C).
International Affiliate Contributions
International Affiliates are chapters of Breakthrough T1D operating in different countries around the world. Each year, they return a small number of contributions to the parent organization.
In 2025, affiliate contributions fell by 26%, from $5.9 million to $4.4 million. Though the absolute monetary change is slight, this is the lowest level of affiliate contributions on record since JDCA began tracking this information.
Investment Gain/Loss
The largest change was seen in investments, the net gain or loss from investment sales. Investments can be short or long-term, posing varying levels of risk. In a given year, the sale of an investment could generate substantial losses or gains. In FY25, this category generated $11 million, a 74% decrease compared to FY24 ($43 million).
Chart C: Income Change vs. Prior Year by Source ($ Millions)
War Chest
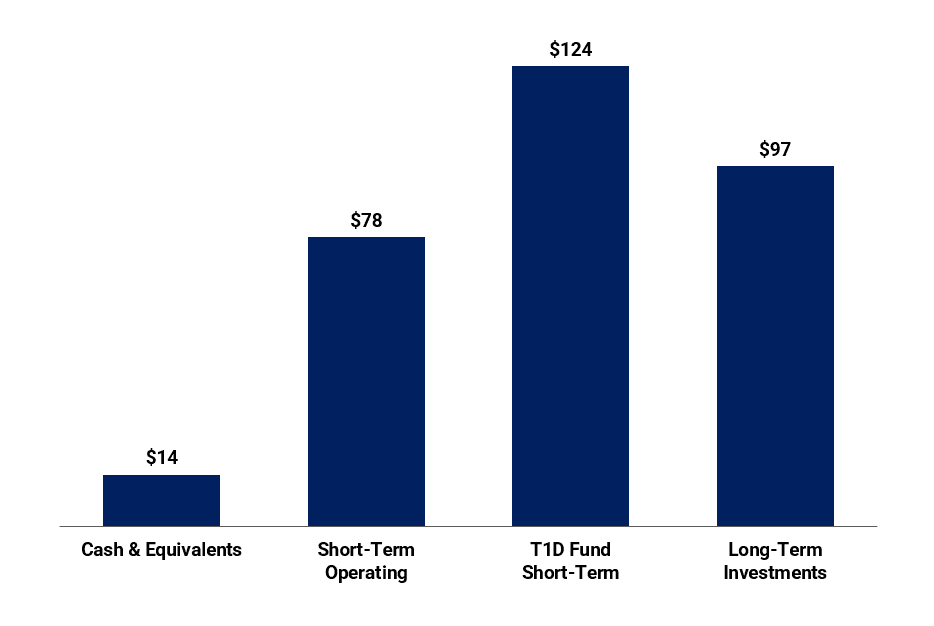
These figures do not include the money the T1D Fund has invested in programmatic T1D companies but do include the $124 million that the T1D Fund is holding in short-term investments. These dollars result from successful fundraising for the T1D Fund and several successful investment exits from prior years. By comparison, the T1D Fund ended FY25 with $71 million in ‘programmatic’ T1D company investments, only $5 million greater than the prior year despite the massive pool of available cash.
Breakthrough T1D also holds $97 million in long-term investments and $92 million in short-term investments and cash.
A nonprofit that holds onto dollars when revenue is declining may be prudent, but when revenue is rising so dramatically, one must ask when these dollars will be used to fulfill the mission. Saving may be good; a cure is better.
Chart D: FY25 Short and Long-Term Investments ($ Millions)