
At a Glance
- ADA’s revenue reached $157 million in FY24, an 8% increase from the prior year.
- Total expenses reached $134 million, with information and payroll as the largest spending areas.
- Overall research grant spending increased by $3 million in FY24 ($25 million total) after two years of stagnation.
- Roughly 2% of revenue went to T1D-specific research.
July 10, 2025
The American Diabetes Association (ADA) released its 2024 fiscal year (FY24) Consolidated Financial Statements, a document detailing the nonprofit’s performance, financial health, and priorities during the past year. This report provides a key-point review of how one of the most influential diabetes nonprofits raised and spent its money in 2024.
All data used within this report were gathered from the ADA’s publicly available Consolidated Financial Statements, spanning January 1, 2024-December 31, 2024, and prior years’ statements, unless otherwise stated.
Revenue: Minor Growth
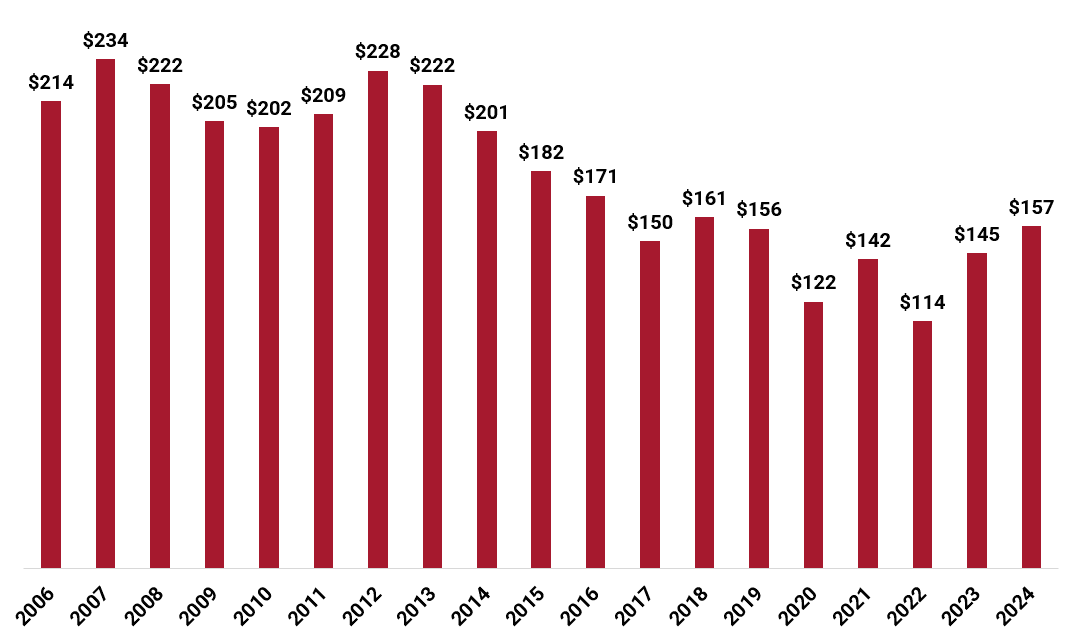
Total revenue in FY24 was $157 million, an increase of 8% from the prior year ($145 million). This is the highest the organization’s revenue has been since 2018 (see chart A).
Despite minor revenue growth compared to FY23, the ADA still pulls in significantly less than in the mid-2000s when JDCA first began tracking this information.
Chart A: ADA Revenue ($ Millions), 2006-2024
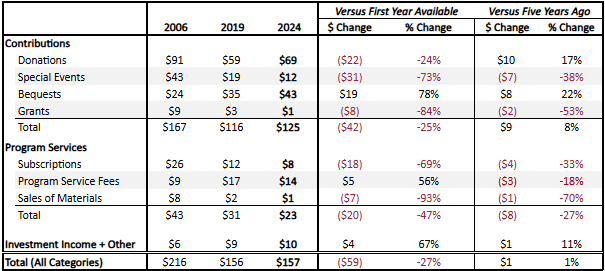
The FY24 revenue increase is attributed to a rise of $7 million in direct donations and $4.5 million in bequests (see chart B). Direct donations, as the name suggests, are made by an individual to an organization without a middleman. Bequests are contributions made following a person’s death.
Chart B: Multi-Year Comparison of ADA Revenue Sources
Expenses: ‘Information’ Persists as Heaviest Spending Category
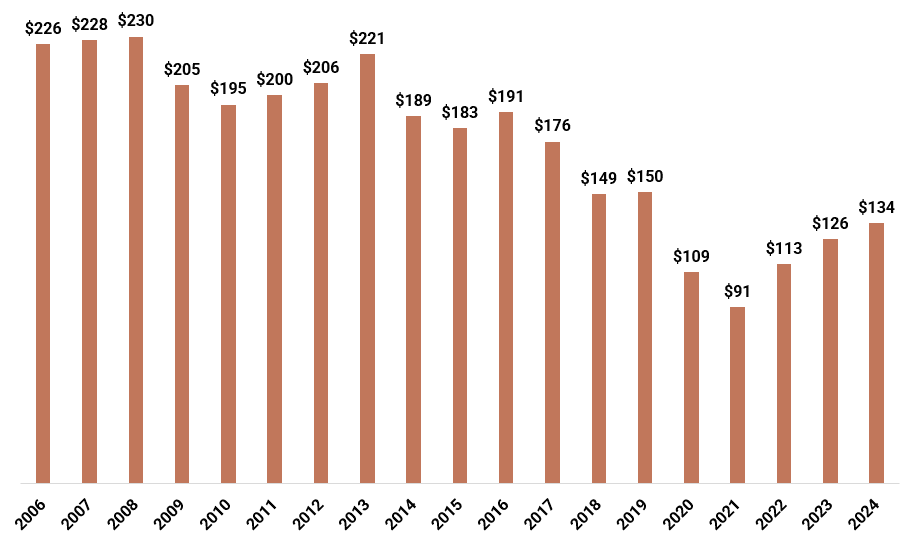
The ADA spent a total of $134 million in FY24 (see chart C). Overall spending has been on a slow but steady rise since 2021, the lowest expense year.
Chart C: ADA Total Expenses ($ Millions), 2006-2024
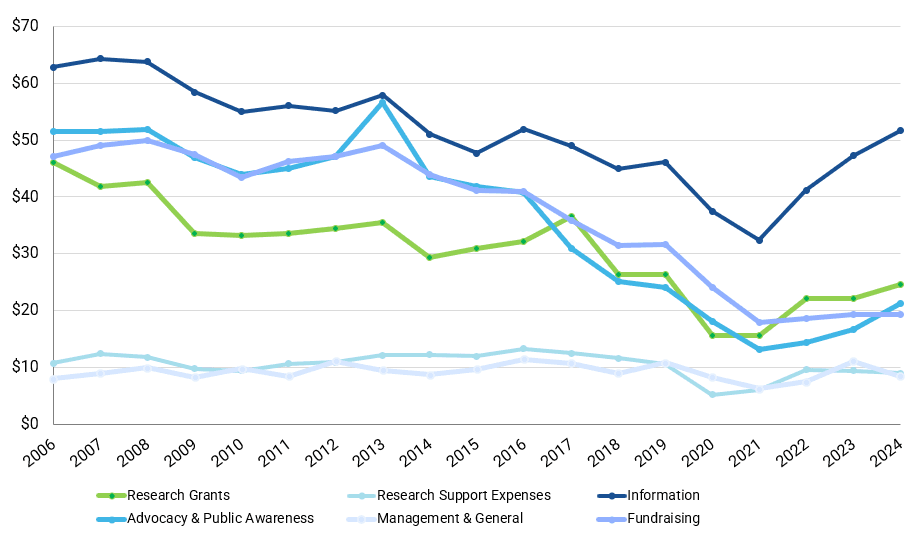
The largest spending category in FY24 was information, totaling $52 million and accounting for 33% of all expenses. Information pertains to the research, creation, and distribution of knowledge to the community, including the annual Standards of Care in Diabetes, one of the most valuable and high-impact products provided by the ADA alongside the annual Scientific Sessions.
Information has been unrivaled as the largest expense category for the past two decades (see chart D).
Advocacy and public awareness also experienced an increase in spending to $21 million, 28% more than the prior year ($17 million).
Chart D: ADA Expenses by Category ($ Millions), 2006-2024
The second-largest spending area was employee costs, including all salaries, payroll, benefits, pensions, and other related expenses. This area grew by 15%, rising from $41 million in FY23 to $48 million in FY24. Though not reflected in the chart for simplicity's sake, payroll is a sub-category of functional expenses and a contributing factor to the major categories illustrated above.
However, management & general saw a reduction. This category includes executive salaries, administration, office space, and others. It was $8.4 million in FY24, a 24% decrease compared to last year ($11 million).
Research Grants: T1D Still an Afterthought
In FY24, ADA’s research grant allocation totaled $25 million. Research grants are spent on all types of diabetes, as well as obesity in general. This is a slight increase of $3 million from the prior year—a move in the right direction, but still much less than it could be.
The ADA no longer follows nonprofit best-practice transparency by putting exact dollar amounts to research grant categories (e.g., T1D vs T2D). Instead, the ADA provides an approximate research funding percentage on its website.
ADA reports that 12% of all research dollars go to T1D-specific research. This amounts to 2% ($3 million) of FY24 revenue. Notably, this is far less than Breakthrough T1D, which spent $104 million on T1D grants (40% of revenue) in the same fiscal year.
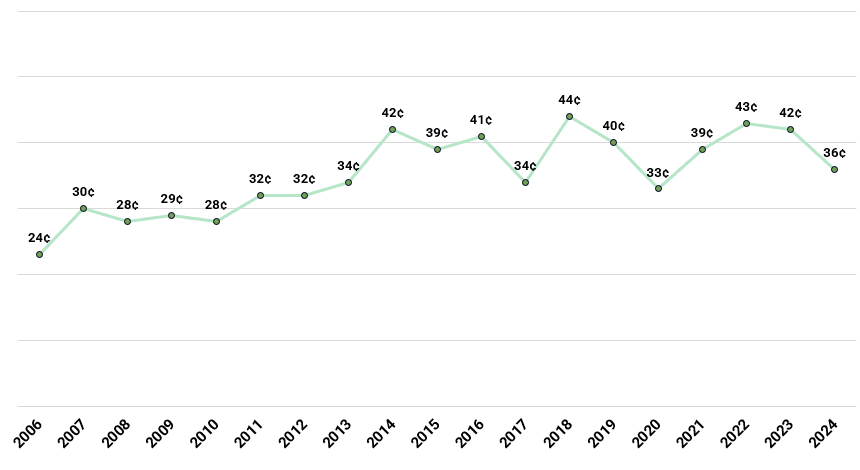
The internal costs associated with distributing research grants have gone down. In FY24, it cost the ADA 36¢ to allocate $1 to research grants compared to 42¢ in FY23. While this reduction is a good thing, the ratio is still much higher than its lowest point in 2006, which was 24¢ per grant dollar (see chart E).
Chart E: Internal Cost of Giving Each Dollar of Research Grants (Historical)
Ending Thoughts
The ADA began as a general diabetes organization, but the dial has tipped more and more toward T2D each year. Recently, this focus has broadened to include tackling obesity as a stand-alone medical problem, even when it is not clinically related to diabetes.
This shift has been felt by the T1D community. It is reflected in annual donor surveys, whose findings show T1D community donors are dissatisfied with ADA’s performance, but would change their tune if the ADA placed renewed importance on T1D.