At a Glance
- Total spending reached a 20-year high.
- All spending categories except rent and miscellaneous grew.
- Fundraising was the fastest-growing major spending category, rising 27% versus FY23 and 33% versus 5 years ago.
- Total research grants grew modestly, receiving 40% of annual revenue, but a decline from FY23 and below guidance expectations.
- Payroll increased 13% versus the prior year, growing by $9 million.
- Conferences, meetings, and professional services had significant gains compared to the prior year and 5 years ago.
June 19, 2025
2024 fiscal year (FY24) total expenses reached their highest level in 20 years. Perhaps not surprisingly, this record spending corresponded to a record revenue year.
More spending could be a good thing if it moves us closer to a Practical Cure for T1D. It is not a good thing if it is primarily absorbed by internal and administrative costs. This report provides a closer look at how revenue was used, category by category. All dollar figures are nominal as reported and not adjusted for inflation.
All data, unless otherwise stated, is sourced from publicly available Consolidated Financial Statements and IRS Form 990 for FY24 (July 1, 2023 – June 30, 2024).
Spending: Rising Fast
The total amount Breakthrough T1D spent during FY24 was a whopping $238 million, a 12% increase from the previous year. The last time total expenses reached this level was in 2008, almost fifteen years ago (see chart A).
Chart A: Breakthrough T1D Total Expenses, 2004-2024 (in Millions)*
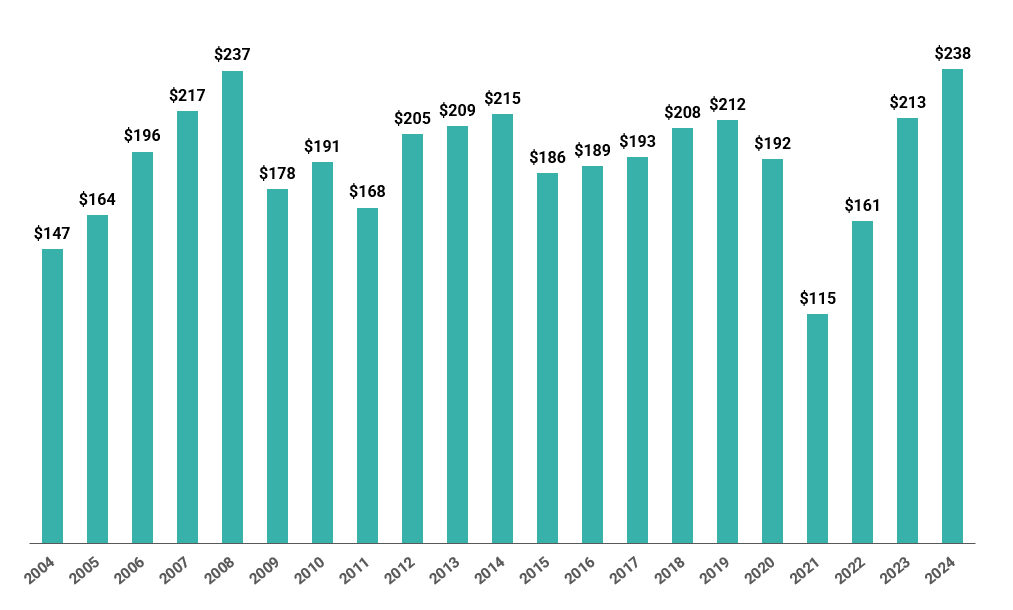
*Nominal - not adjusted for inflation
Is this level of spending sustainable? If revenue remains as high as it was in FY24, expenses can continue to rise, and more can be deployed to grants and programs that accelerate a cure.
However, the top increase among major expense categories was fundraising, not grants or programs. Fundraising grew by $9 million versus the prior year. All other categories also rose, including payroll, meetings, consultant fees, and education.
Research Grants: 10-Year High
Research grants include money given to academic centers and, less commonly, commercial enterprises conducting research for T1D. These grants are often committed over multiple years and address a range of research objectives, including complications, glucose control, mental health, global access to care, and cure research.
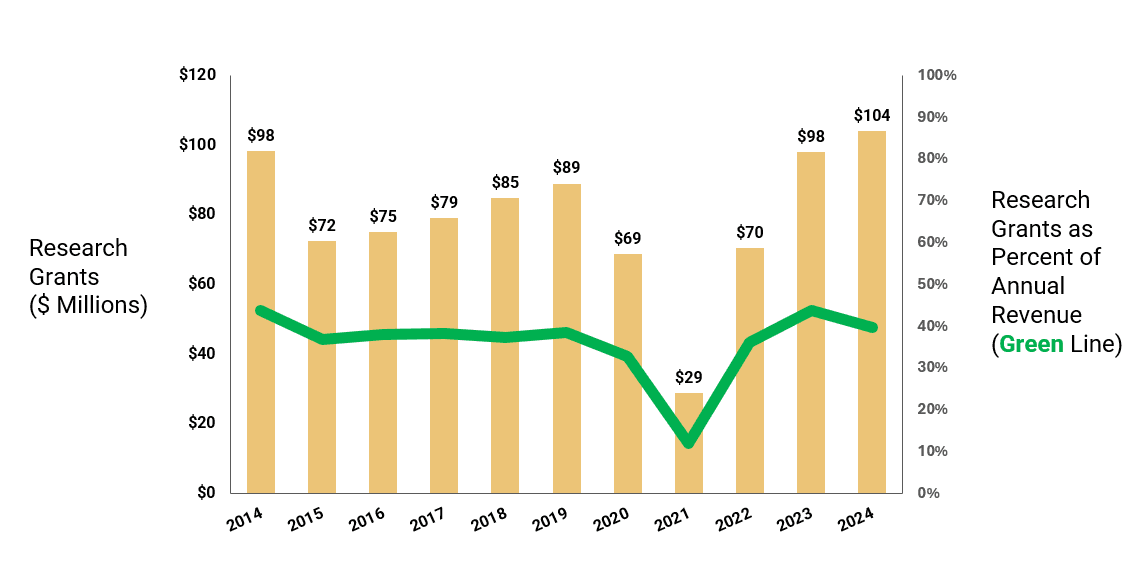
In FY24, research grants grew by $6 million to a 10-year high of $104 million (see chart B). This is the first time in a decade that grants topped $100 million in a single year.
However, as a percentage of total income, research grants fell versus the prior year, indicating a potential decline in importance. In FY24, only 40% of the revenue was used for research grants, compared to 44% in FY23.
If the main work output of Breakthrough T1D is to fund research pushing breakthroughs in T1D, spending only a minority of each dollar on research grants seems off-strategy and unaligned with donor priorities, who continue to emphatically state that a cure is job #1.
Chart B: Research Grant Trends, 2014-2024
It is worth noting that this number reflects the amount used for grants and does not include internal costs associated with distributing these grants. Breakthrough T1D reports its total research budget as a larger number, totaling actual grants, the internal cost of giving these grants, and advocacy program expenditures. Generally accepted accounting rules require that both research grants and related costs be reported and visible. Therefore, including advocacy in the research total is a leadership choice.
The number we are reporting does not include the amount of money the T1D Fund invested in commercial entities, either in purchasing stock or convertible loans. Although the T1D Fund is represented in Breakthrough financials, in FY24 it purchased equity in companies with money raised from specific fundraising rounds from prior years and/or money from successful exits that are currently stored in short- and long-term investment vehicles.
In FY24, the T1D Fund used $18 million to purchase equities or provide convertible loans. If that number is included, the amount of grants plus T1D Fund investments would reach 51% of revenue.
Payroll and Salaries Return to Pre-COVID Levels
In FY24, payroll and salaries paid by Breakthrough T1D returned to pre-COVID levels, giving up the efficiency and rightsizing that took place during those years. Payroll costs reached $79 million in FY24, a 13% increase from prior years (see chart C).
Chart C: Payroll and Salary Expenses ($ Millions)
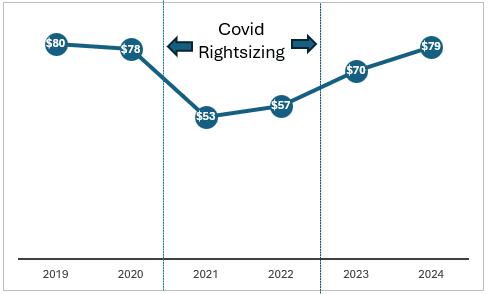
Like many companies and nonprofits during COVID, Breakthrough optimized its infrastructure, including staffing and offices. In 2021, they achieved a significant reduction in payroll, providing cost savings that could be used for enhancing grants and other programs. As of FY24, however, these gains have been lost.
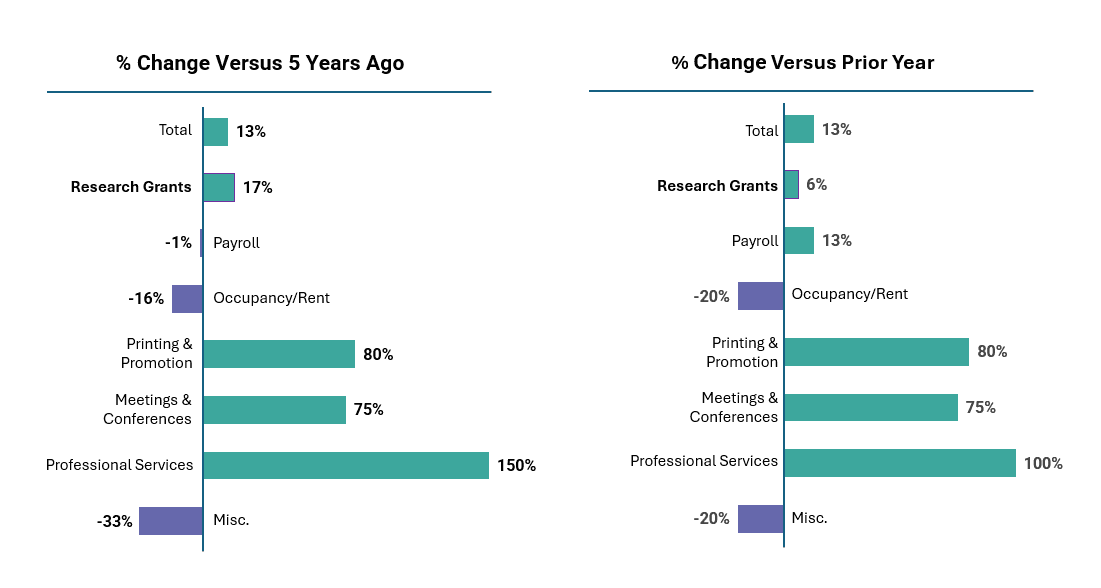
Secondary Spending Categories Higher; Rent Remains Lower
Breakthrough T1D increased its spending substantially in several of its secondary and smaller categories. Printing, promotion, meetings, conferences, and professional services all increased by double or triple digits (see chart D).
The actual amounts are relatively small, but the percentage increase is large. Printing and promotion grew from $5 to $9 million; meetings and conferences grew from $4 to $7 million; and professional services grew from $10 to $20 million.
On the other hand, costs for building and office rent remained significantly lower than the prior year and five years ago. This was also streamlined during COVID, and those efficiency gains are maintained today.
Chart D: Expense Categories Percent Change in Spending