At a Glance
- Breakthrough T1D released its latest audited financial statements for the 2025 fiscal year (FY25).
- Total revenue for FY25 was a record high of $300 million, a 14% increase from last year.
- Total expenses also reached a record high at $280 million, up 18% from FY24.
- Research grant spending rose to $121 million, up 16% from the prior year and taking its place as the largest expense category (40% of total revenue).
May 14, 2026
Last week, Breakthrough T1D released consolidated financial statements for its most recent fiscal year (July 1, 2024 - June 30, 2025).
Below is a brief topline overview, focusing on the main findings for revenue, expenses, and research grant spending. In-depth analyses of these topics will be published in the weeks ahead.
These financial statements put a practical lens on the organization's operational priorities and activities. We can see from these statements where the organization chose to spend its money and resources and, conversely, where it did not. Monetary allocations indicate an organization’s actual priorities and serve as a good check on whether stated priorities are being pursued.
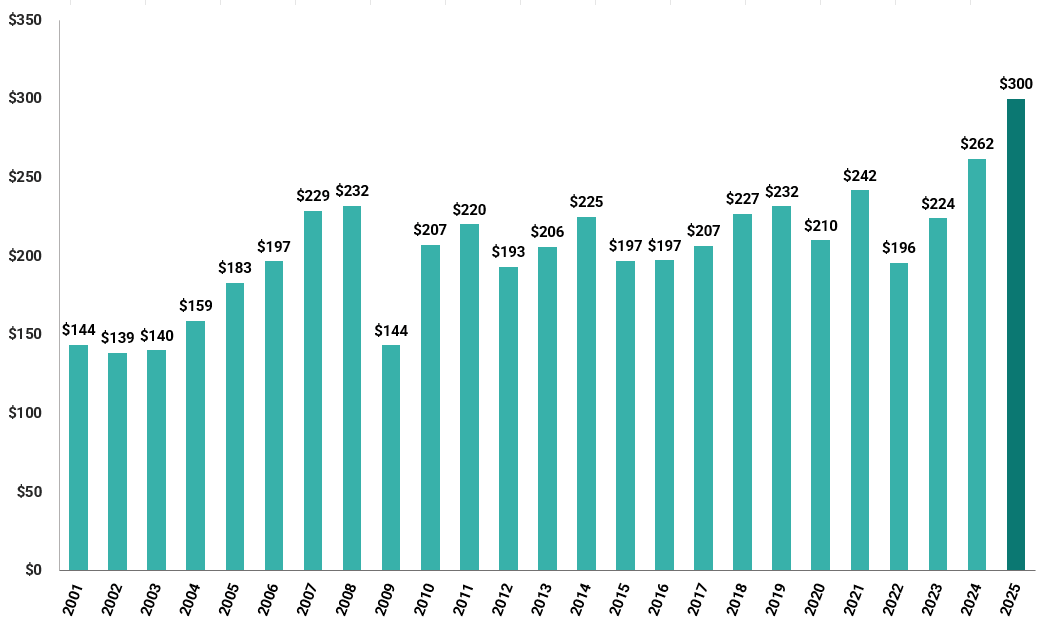
Revenue: Another Record Year
In fiscal year 2025, Breakthrough T1D’s revenue was $300 million, an increase of 14% from the prior year. This is the highest revenue year since JDCA began tracking the nonprofit’s financials in 2001 (see Appendix A).
This gain is primarily due to a $65 million increase in public contributions (from $107 million in FY24 to $172 million in FY25). In total, public contributions comprised 57% of the nonprofit’s revenue in FY25, a record-high level.
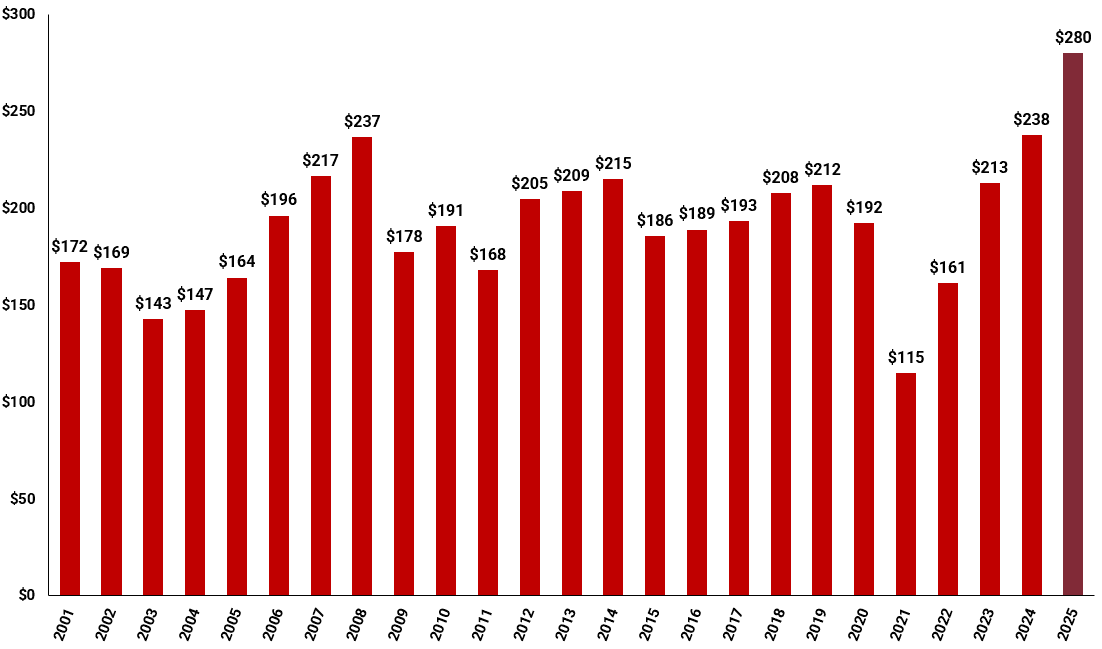
Expenses: Another Record High
Total expenses in FY25 were approximately $280 million, an increase of $42 million from the prior fiscal year (18%). Following on the same path as revenue, this is the highest level of spending since JDCA began tracking this information (see Appendix B).
The increase in spending is attributed to a rise in research grants ($17 million increase), fundraising expenses ($9 million increase), and public education ($8 million increase).
Research grants accounted for the largest spending category at 40% of total revenue, consistent with FY24. Continued growth in research grants is good for T1D, providing more support for scientists. JDCA also notes that research grants increased the most of any other spending category.
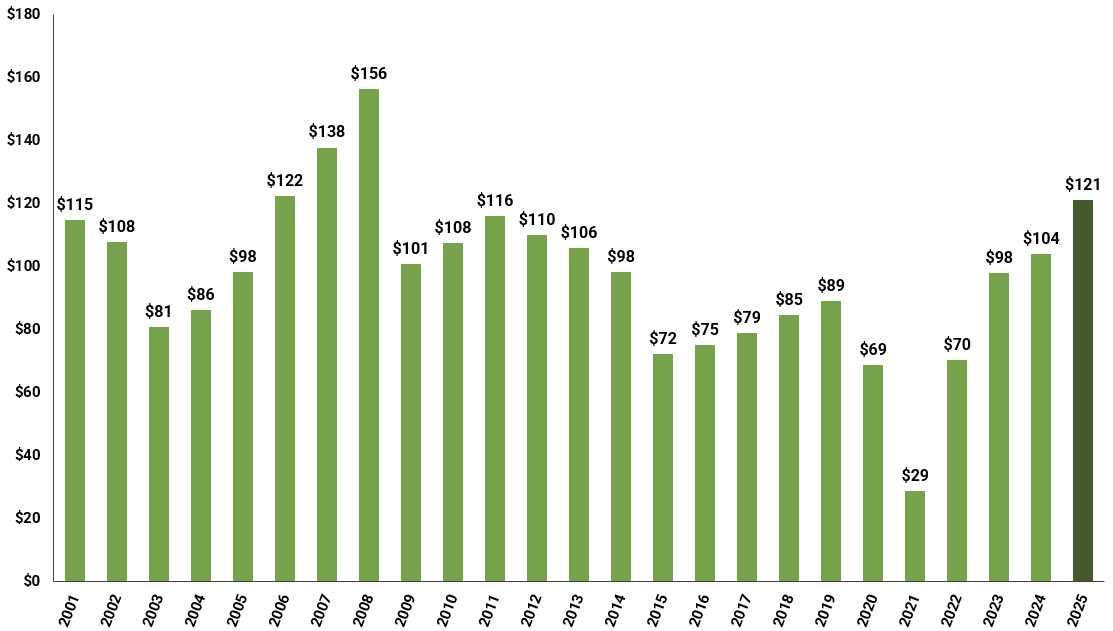
Research Grant Spending: Highest Level Since 2008
Breakthrough T1D allocated $121 million to research grants, an increase of 16% from FY24. This is the highest level of research grant spending from the nonprofit since 2008 (see Appendix C).
An increase in funding for T1D research is a positive development and is consistent with JDCA advocacy. We hope that a substantial portion of this increase will support Practical Cure research. A subsequent report will review research grants in greater depth, focusing on which types of research are the highest and lowest priorities.
Investment Reserve: A Large War Chest
Breakthrough T1D ended FY25 with a $313 million war chest of cash and investments. Broadly speaking, there are three strategic money management buckets: (1) Short-term operating investments, cash, and cash equivalents, (2) Long-term investments, and (3) Programmatic investments made by the T1D Fund.
Breakthrough T1D ended FY25 with $202 million in short-term operating investments, with the majority—$178 million—held in short-term investments. This amount has risen 890% since 2019, the year immediately before the COVID pandemic.
Long-term investments were $97 million at the end of FY25, a small increase from the prior year. Programmatic investments, which reflect the amount of equity investments currently held by the T1D Fund, were $66 million, a 10% gain from the prior year.
Appendix A: Total Revenue by Year ($ Millions)
Appendix B: Total Expenditures by Year ($ Millions)
Appendix C: Research Grant Funding by Year ($ Millions)