At a Glance
- ADA’s revenue in FY25 was $172 million, fueled by rising donations that made up 51% of revenue.
- Expenses rose to $147 million, with information receiving priority funding.
- In FY25, ADA distributed only 16% of total revenue to research grants across seven disease areas ($28 million).
- T1D-specific research grants received $3 million, less than 2% of ADA’s total revenue.
- Rising revenue and ADA’s announcement of a new T1D Committee provide a new, greater opportunity to reestablish its commitment to T1D.
June 4, 2026
Last week, the American Diabetes Association (ADA) released its publicly available consolidated financial statements for its most recent fiscal year (January 2025 – December 2025). Revenue, at $172 million, has reached a nine-year high, while expenses have returned to pre-COVID levels.
This report provides an analytical overview of one of the nation’s largest diabetes-focused nonprofits. Key topics include how money was raised, distributed, and what level of importance is placed on T1D.
The ADA was founded as a general diabetes organization in 1939. Within the past decade, the nonprofit has shifted away from T1D and put disproportionate focus on T2D, creating a rocky relationship with the T1D community.
However, the steady increase in revenue in the past several years and the creation of a dedicated T1D committee provide a new, greater opportunity to do more for T1D and generate renewed community support. This could be a real win-win for both parties: Turning around the ADA’s declining relationship with the T1D community, unlocking additional fundraising, and, most importantly, helping accelerate a cure for T1D. We urge the ADA to use this growth to double down on its commitment to T1D.
Highest Revenue Since 2015
Chart A: ADA Historical Revenue ($ Millions), 2006-2025
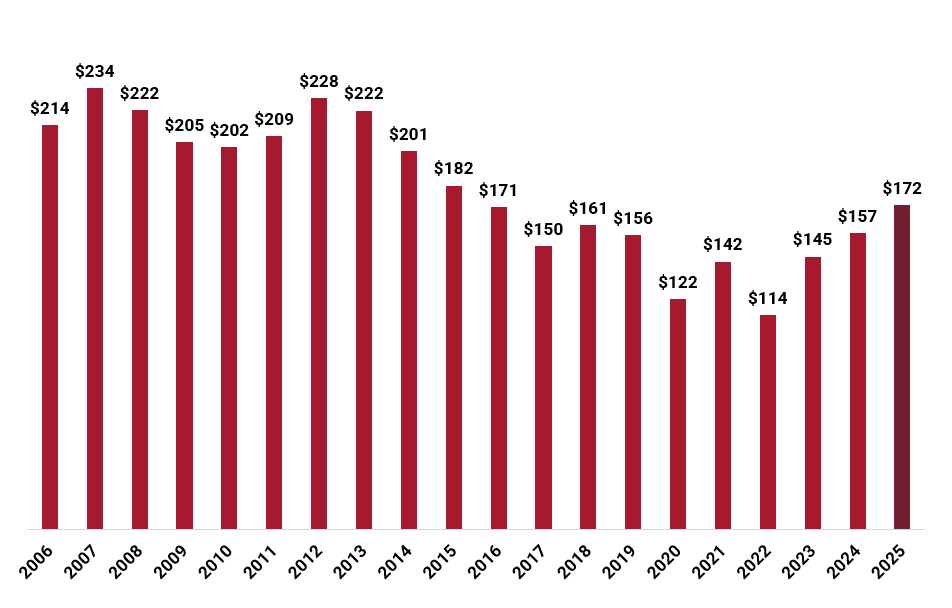
*Nominal, not adjusted for inflation.
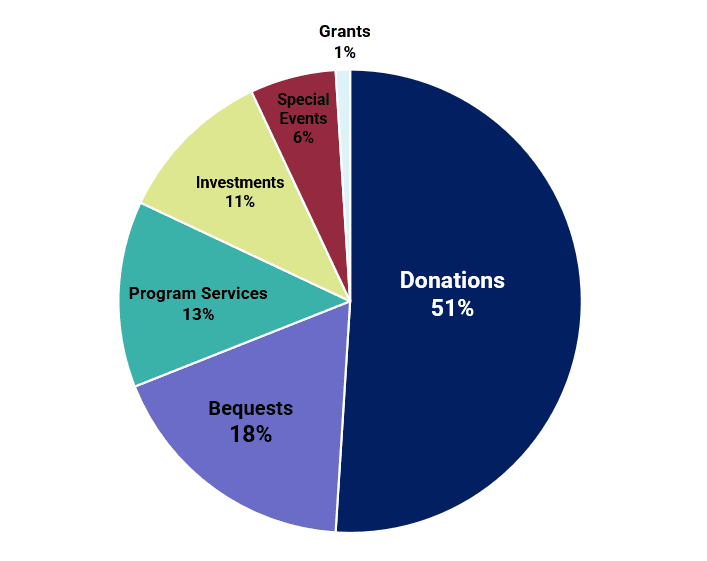
Contributions – The Biggest Driver of Revenue
Chart B: Sources of FY25 Revenue, as Percentages of Total
Other Sources of Revenue
The second-largest revenue source is from $31 million in bequests, donations made following a person’s death. This category, though a meaningful contributor to revenue, fell by 27% compared to FY24 ($43 million).
Other sources include $23 million from program services, including subscriptions and the sale of materials, $18 million from investments, and $11 million from special events. Investments, successful gains from exchange transactions and investments, exhibited the most growth of all categories, increasing by 80% compared to FY24 ($10 million).
Spending Prioritizes Information Over Research
In FY25, the ADA reported a total of $147 million in expenses, an increase of 10% from FY24 (see chart C). Each expense category saw minimal monetary changes, none rising or falling by more than $4 million.
Chart C: ADA Historical Expenses ($ Millions), 2006-2025
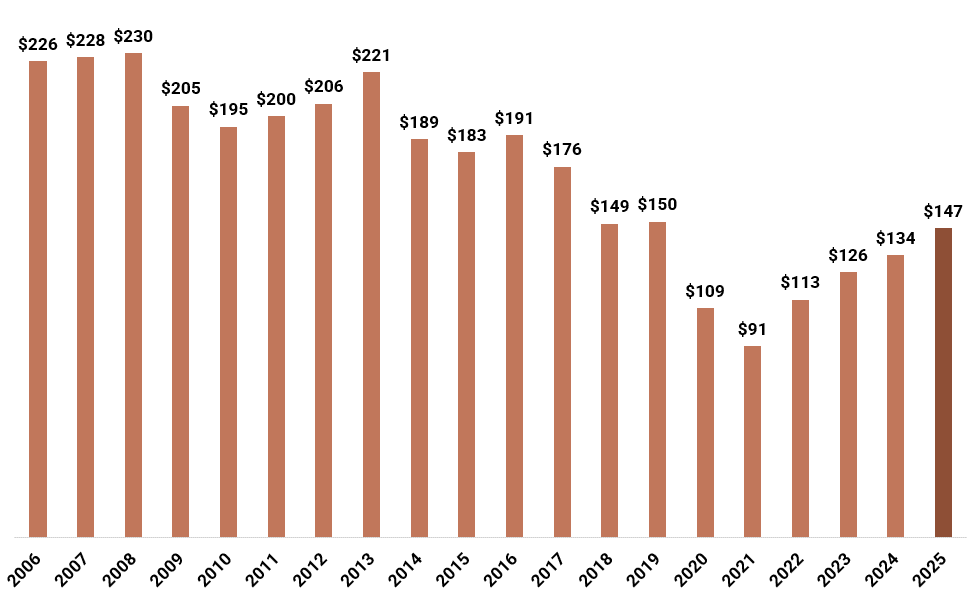
*Nominal, not adjusted for inflation.
Largest Expense Category: Information
Since JDCA began tracking financials in 2006, the ADA’s largest expense category has been what the ADA refers to as “information” (see chart D). This funding fuels the dissemination of diabetes-specific knowledge to the public, including two of the ADA’s most important and unique contributions to diabetes: The annual Standards of Care in Diabetes publication and the annual Scientific Sessions, the leading diabetes conference worldwide.
Totaling $56 million, information makes up 38% of all spending and is at the highest level since 2013 ($58 million).
Chart D: FY25 Expense Categories as a Percentage of Total Spending
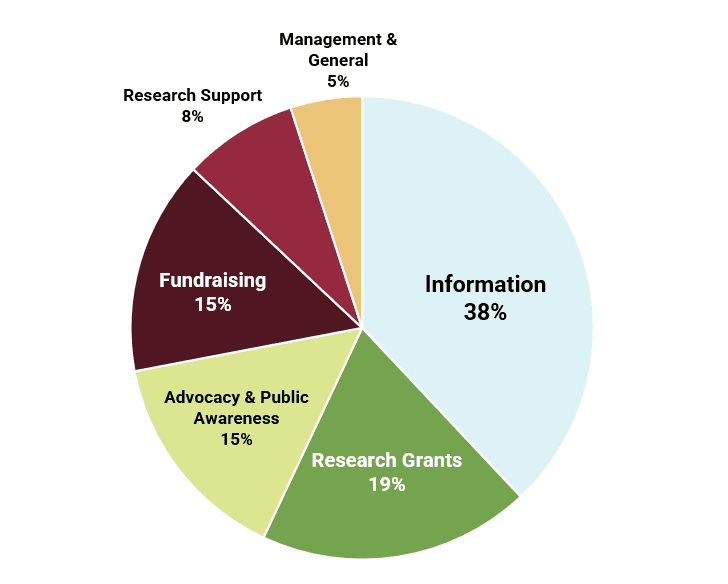
Other Spending Categories
The second-largest spending category was for research grants ($27 million), an increase of 12% from the prior year ($25 million). Advocacy & public awareness ($23 million) and fundraising ($22 million) were the other notable expense areas.
The only category to reduce spending from the prior year is management & general, which includes administration, office space, salaries, and other expenses, falling by $1 million. The ADA has managed to keep this category materially lower than in pre-COVID years.
Research support is the fastest-growing expense category, increasing by 33% from FY24 ($9 million) to FY25 ($12 million). Research support, not to be confused with research grants, funds indirect costs for research, institutional support, administrative services, and other forms of assistance that do not provide direct funding to projects.
Research Grants Bump Higher While T1D Sits Low
ADA allocated $28 million to research grants in FY25, an increase of 12% from the prior year ($25 million). ADA provides grant funding to seven disease areas, including T1D, T2D, gestational diabetes, and others. In total, the ADA gives only 16% of total revenue to all research grant categories, the same percentage as last year despite growing resources.
The nonprofit is not as transparent as it was in the early years of JDCA coverage, when specific grant spending was shared in line with governance best practices. It is unknown why the ADA actively chooses not to make this information public, even when requested, since these grants are funded by public donations.
Transparency is a best practice among other large nonprofit organizations and is key to accountability and open engagement with donors. It fosters trust. We hope the ADA rethinks its policy toward sharing details of its grant funding and/or explains why it refuses to do so. That said, the ADA website provides an approximate percentage breakdown of each disease area.
Despite the gain in revenue, T1D-focused research accounts for only 12% of research grant funding, about $3 million in total. This equates to 1.9% of revenue. In comparison, T2D-focused research received 41% of research dollars, and the Obesity Association, a new subdivision of the ADA, received 14%. T2D remains the clear focus of the ADA.
However, the ADA recently announced the creation of the National T1D Committee. JDCA hopes the organization will use this as a platform to restore its commitment to T1D and push forward cure breakthroughs.
Internal Costs of Delivering Research Grants
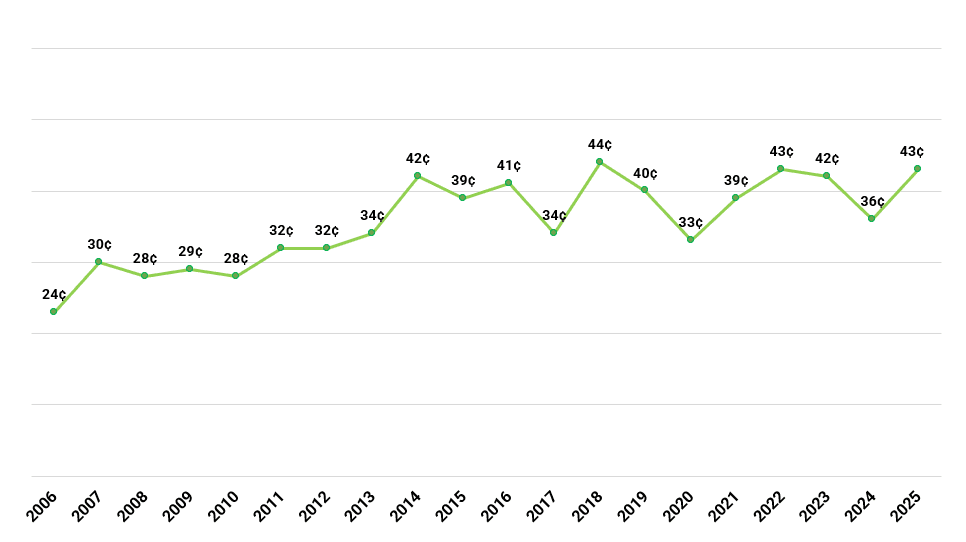
In FY25, it cost the ADA 43¢ to allocate $1 in research grants, compared to 36¢ in FY24. This is nearly double the cost of giving grants in 2006, our earliest year on record (see chart E). We do not know why the cost of giving away each dollar of grants has increased so substantially over time, but it remains a glaring area for efficiency improvement.
Chart E: Internal Cost of Giving Each Dollar of Research Grants (Historical)