
At a Glance
- Breakthrough T1D set a 20-year record revenue in FY24 at $262 million.
- Revenue grew by 17% ($38 million) versus the prior year.
- Over 2/3 of the revenue growth came from a 33% increase in direct donations.
- Direct donations now generate as much revenue as special fundraising events.
- Investment income, a typically volatile metric, was a major growth factor in FY24.
June 5, 2025
Breakthrough T1D sets a revenue record in fiscal year 2024 (FY24), from July 1, 2023 to June 30, 2024.* This is the highest revenue of any year since we began tracking this information in 2001.
This report takes a comprehensive look at the drivers of revenue growth and addresses sustainability. All data used in the report, unless otherwise stated, is sourced from publicly available financial records. All dollar figures are nominal as reported and not adjusted for inflation.
*FY24 data is sourced from publicly available Consolidated Financial Statements and IRS Form 990s.
Total Revenue
Total revenue consists of money received from all sources, including donations and investment gains. These funds are what Breakthrough T1D uses to make research grants, run advocacy programs, and pay salaries and overhead. The more money raised, the more it can do, and the more ‘breakthrough’ impact we expect.
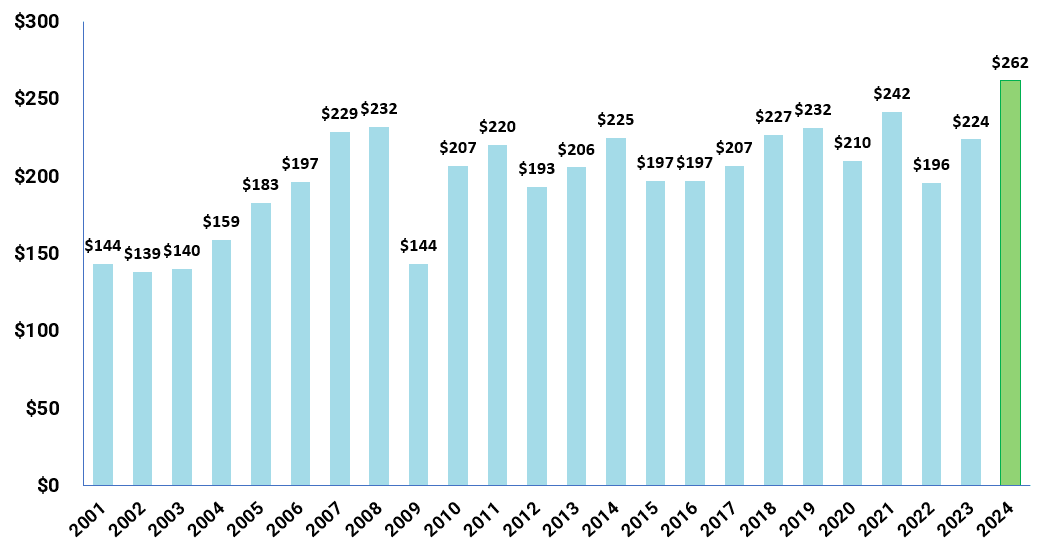
FY24 is a standout revenue year, the highest in JDCA records (see chart A). Compared to FY23, revenue grew by $38 million. The second-highest revenue year was 2021 ($242 million), fueled by new T1D Fund contributions and benefited from the penny-pinching COVID years.
Chart A: Breakthrough T1D Historical Revenue ($ Millions)
What Additional Impact Can We Expect?
Many opportunities can benefit from the additional funding made possible by boosted revenue. Project ACT is a strong new marketing and, hopefully, strategic program that Breakthrough T1D launched in November of last year.
On paper, the initiative addresses many of the priorities JDCA has been advocating for over a decade. This is the right area of focus. More funding can enhance these programs, put strong, actionable metrics in place, and ultimately deliver a Practical Cure.
Growth Versus 2023
Six main categories generate revenue for nonprofits. These categories were established and unified by IRS rules.
- Contributions: Individual, corporate, and in-kind donations.
- Special Events: Walks, Galas, rides, etc.
- Int’l Affiliates: Fees paid by Breakthrough T1D affiliates abroad.
- Investments: Gain or loss from investment sales.
- Debt: Write-off of bad debt, etc.
- Other: Mostly royalties from intellectual property licenses.
The $38 million revenue increase is primarily attributed to direct contributions and a positive return on investments (see chart B). Direct contributions are the biggest factor, totaling $107 million in FY24 ($26 million increase from FY23). Breakthrough T1D has been very effective at expanding this revenue stream. Presumably, T1D donors see value in their gifts and trust the organization to fulfill their high expectations for cure breakthroughs.
Chart B: Drivers of Revenue vs. Prior Year ($ Millions)

The Big Dogs: Fundraising Versus Direct Contributions
Every year, the two largest contributors to revenue are direct contributions and special events. In FY24, the two categories totaled $213 million, about 81% of total revenue. In most years, when investment contributions are lower, the percentage is even higher.
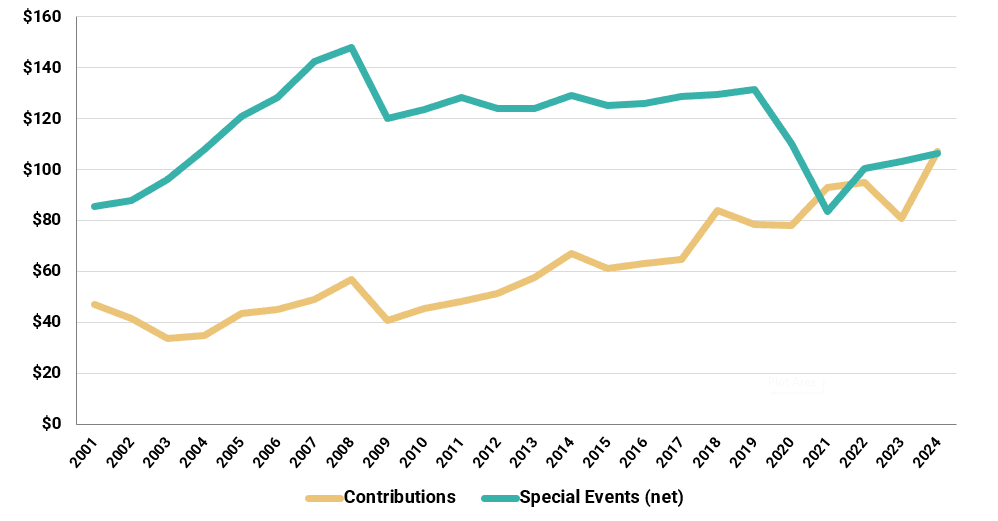
Revenue from direct contributions is almost equal to revenue from special fundraising events. This is a distinct change from the pre-COVID years. Before 2019, special events contributed an average of 65% of revenue annually; direct contributions an average of 35%. While this number fluctuated from year to year, the general trend was unchanged (see chart C).
It is likely that due to the decrease in regional offices and manpower during COVID, there remain fewer overall events, both national and, perhaps more importantly, local. On the other hand, extra efforts at driving direct contributions have more than offset this decline. There may be an opportunity to continue growing revenue by encouraging selective fundraising events.
Chart C: Direct Contribution vs. Special Events Revenue by Year ($ Millions)
Investment Income
Investment income is the net gain or loss from the sale of any type of investment. Breakthrough T1D carries a large portfolio of historical investments that were purchased, mostly with donor funds not used for research grants or other advocacy programs. These investments are short and long term, lower risk and higher risk. This includes bonds, equities, and money given to hedge funds and other investment advisors. They also include stock held by the T1D Fund.
When an investment is sold, it generates a profit or a loss. Since 2001, investment income has added a net of $272 million to Breakthrough T1D. In most years, the investment income is positive. In some years, when losing investments are liquidated, it is negative (see chart D).
Chart D: Investment Income by Year ($ Millions)

Sustainability & Final Thoughts
Based on revenue alone, Breakthrough T1D seems to be on a hot streak, suggesting donors believe it will deliver the research breakthroughs and cure progress the community holds as the top priority.
Breakthrough T1D has the opportunity to truly accelerate cure development. The nonprofit holds significant influence in the T1D research ecosystem. By investing more resources and applying pressure to academic and for-profit research communities, Practical Cure research could be put into hyperdrive. This is especially needed for pushing more research toward protecting insulin-producing cells from the autoimmune attack that defines T1D.
Project ACT may be the vehicle for this, but it needs real teeth—annual goals, measurable metrics, and a degree of independence from the careful and steady way dollars have been allocated in the past.