A previous version of this article incorrectly reported the ADA’s revenue in 2006 as $322 Million, and its research grant expenditure that year as $67 Million. In 2006, the ADA reported their fiscal year numbers in an 18-month, rather than the traditional 12-month, time frame. The report is updated to show the correct numbers for a 12-month period.
Accordingly, the organization's 2006 revenue is adjusted to $216 Million and its research grant expenditure is adjusted to $46 Million. The decline in revenue between 2006 and 2020 is adjusted from a decline of 62% to a decline of 44%.
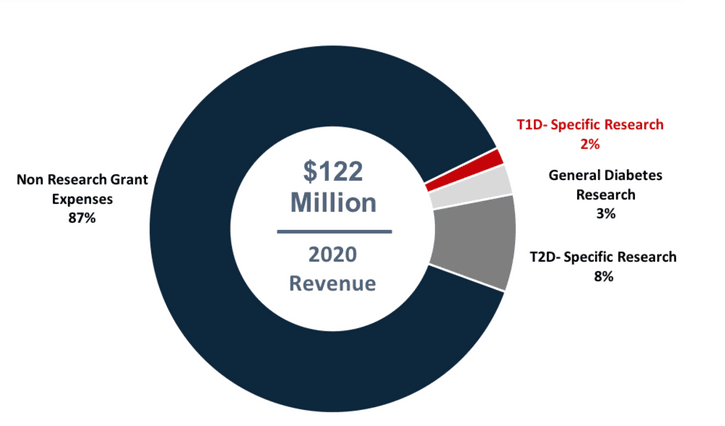
The amount ($1.9 Million) that ADA spent on T1D grants in 2020 is sourced from page 19 of the organization's 2020 Annual Research Report.
This report will analyze the 2020 financial disclosures of the American Diabetes Association (ADA). With a strong fundraising infrastructure, ties on Capitol Hill, and access to researchers throughout the world, the ADA is well-positioned to act as a forceful lever for T1D cure research.
There are two major takeaways from this analysis. First, the ADA has lost considerable revenue – and arguably relevance – over the last 15 years. Second, the organization is not the best choice, in our view, for donors who wish to support T1D cure research. The majority of the ADA’s resources are directed to non-research expenses such as publishing, advocacy, fundraising, salaries, and overhead. Much of this activity, as well as the majority of its research grant funding, is focused on type 2 diabetes.
Key Facts and Figures:
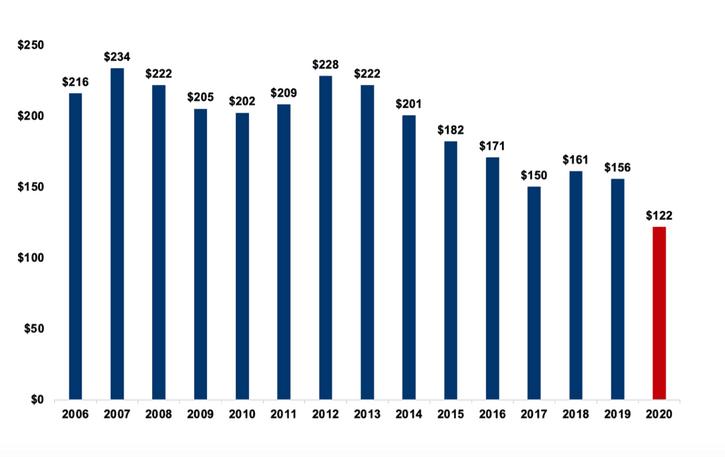
- -44%: Drop in revenue over the last 15 years. See Appendix A.
- $216 Million: ADA revenue in 2006
- $122 Million: ADA revenue in 2020
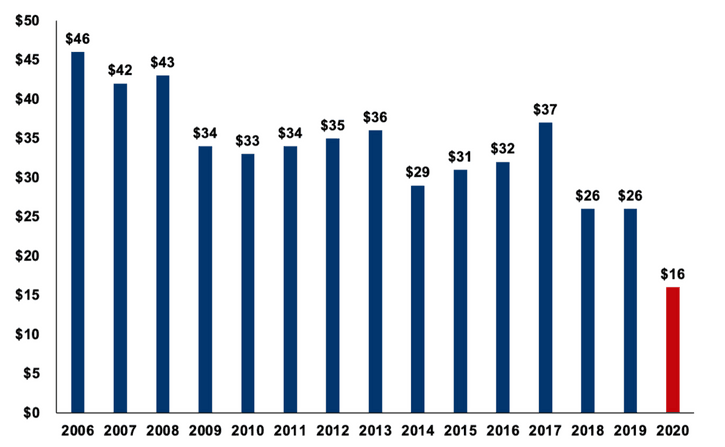
- $16 Million: The amount the ADA spent on research grants in 2020, a 15-year low. See Appendix B.
- $0.13: The amount of every donated dollar that went to research grant funding, a 15-year low.
- $1.9 Million: The amount the ADA spent on T1D-specific research grants in 2020. See Appendix C.
- $0.02: The amount of every donated dollar that went to T1D-specific research grant funding.
Appendix A: ADA Revenue by Year (Millions)
Appendix B: : ADA Research Grant Spending by Year (Millions)
Appendix C: ADA Expense Breakdown – Research vs. Non-Research