This report shows how JDRF utilized the money it raised – almost entirely from donor generosity – during Fiscal Year (FY) 2020. For JDRF, the fiscal year started on July 1, 2019, and ended on June 30, 2020, four months after the COVID-19 pandemic began in the United States.
Financial statements are where ‘the rubber meets the road’ for nonprofits. The documents show the priorities of the organization and how efficiently it operates.
This report will review the major expense categories that JDRF put its money behind in 2020. One key finding is that the amount JDRF used for T1D research grants dropped to a 20-year low in both absolute dollars and percent of revenue. At the end of the report, we will look back 20 years – to 2001 – and ask if the JDRF of 2000 would recognize the JDRF of 2020.
JDRF Functional Expenses
FY 2020 JDRF Functional Expenses
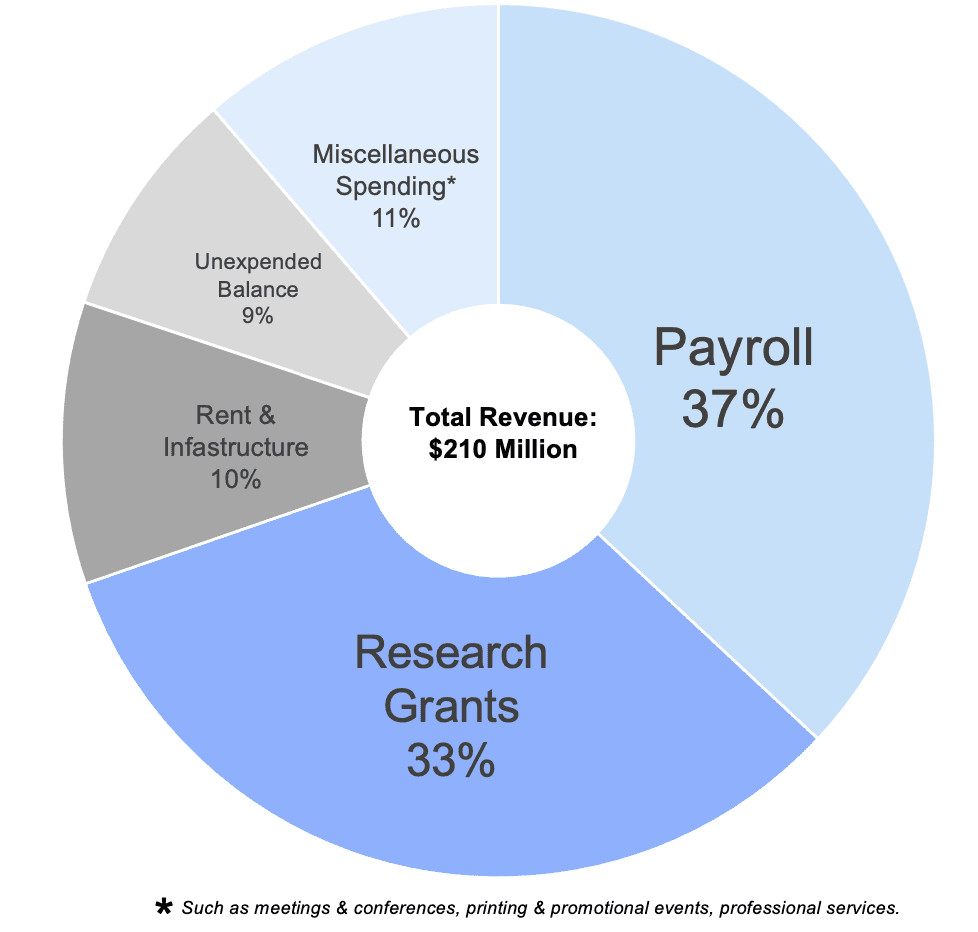
The chart above shows the proportion of money spent on each expense category during 2020. Thirty-seven cents out of every one dollar JDRF raised was spent on payroll (salaries and bonuses for staff), more than any other expense category. We expect that this number will decline in 2021 as a result of staff streamlining announced last summer which is not yet reflected in the 2020 numbers.
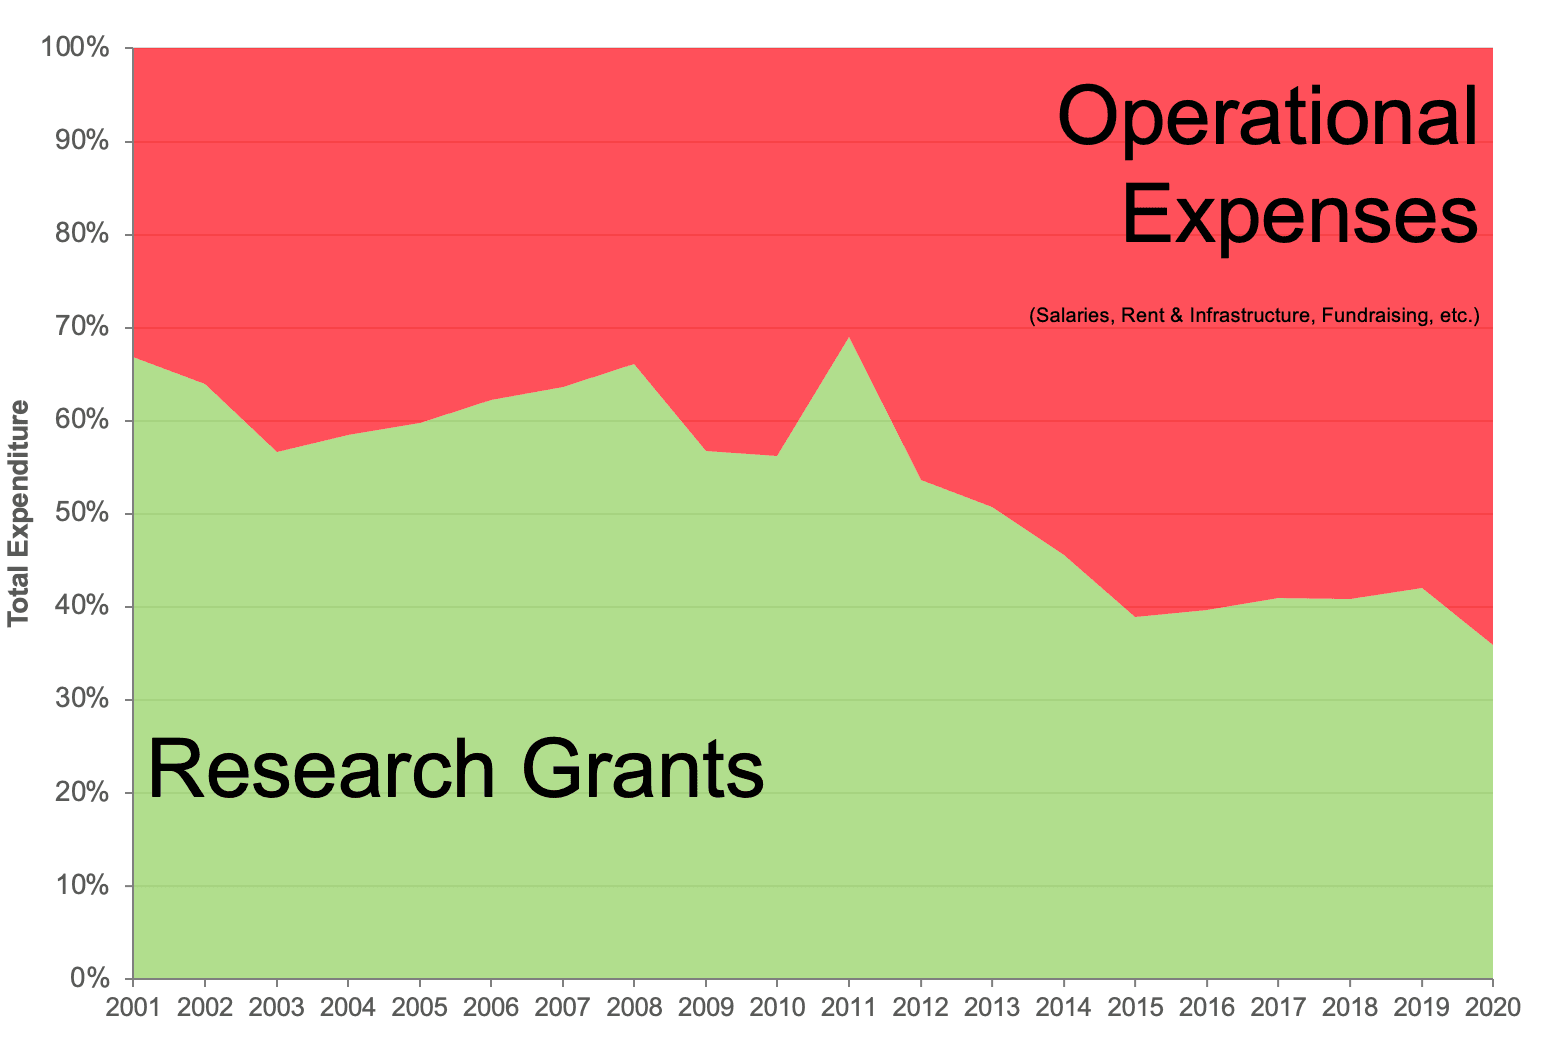
JDRF Research Grant Expenditure as % of Total Revenue, FY 2000-2020
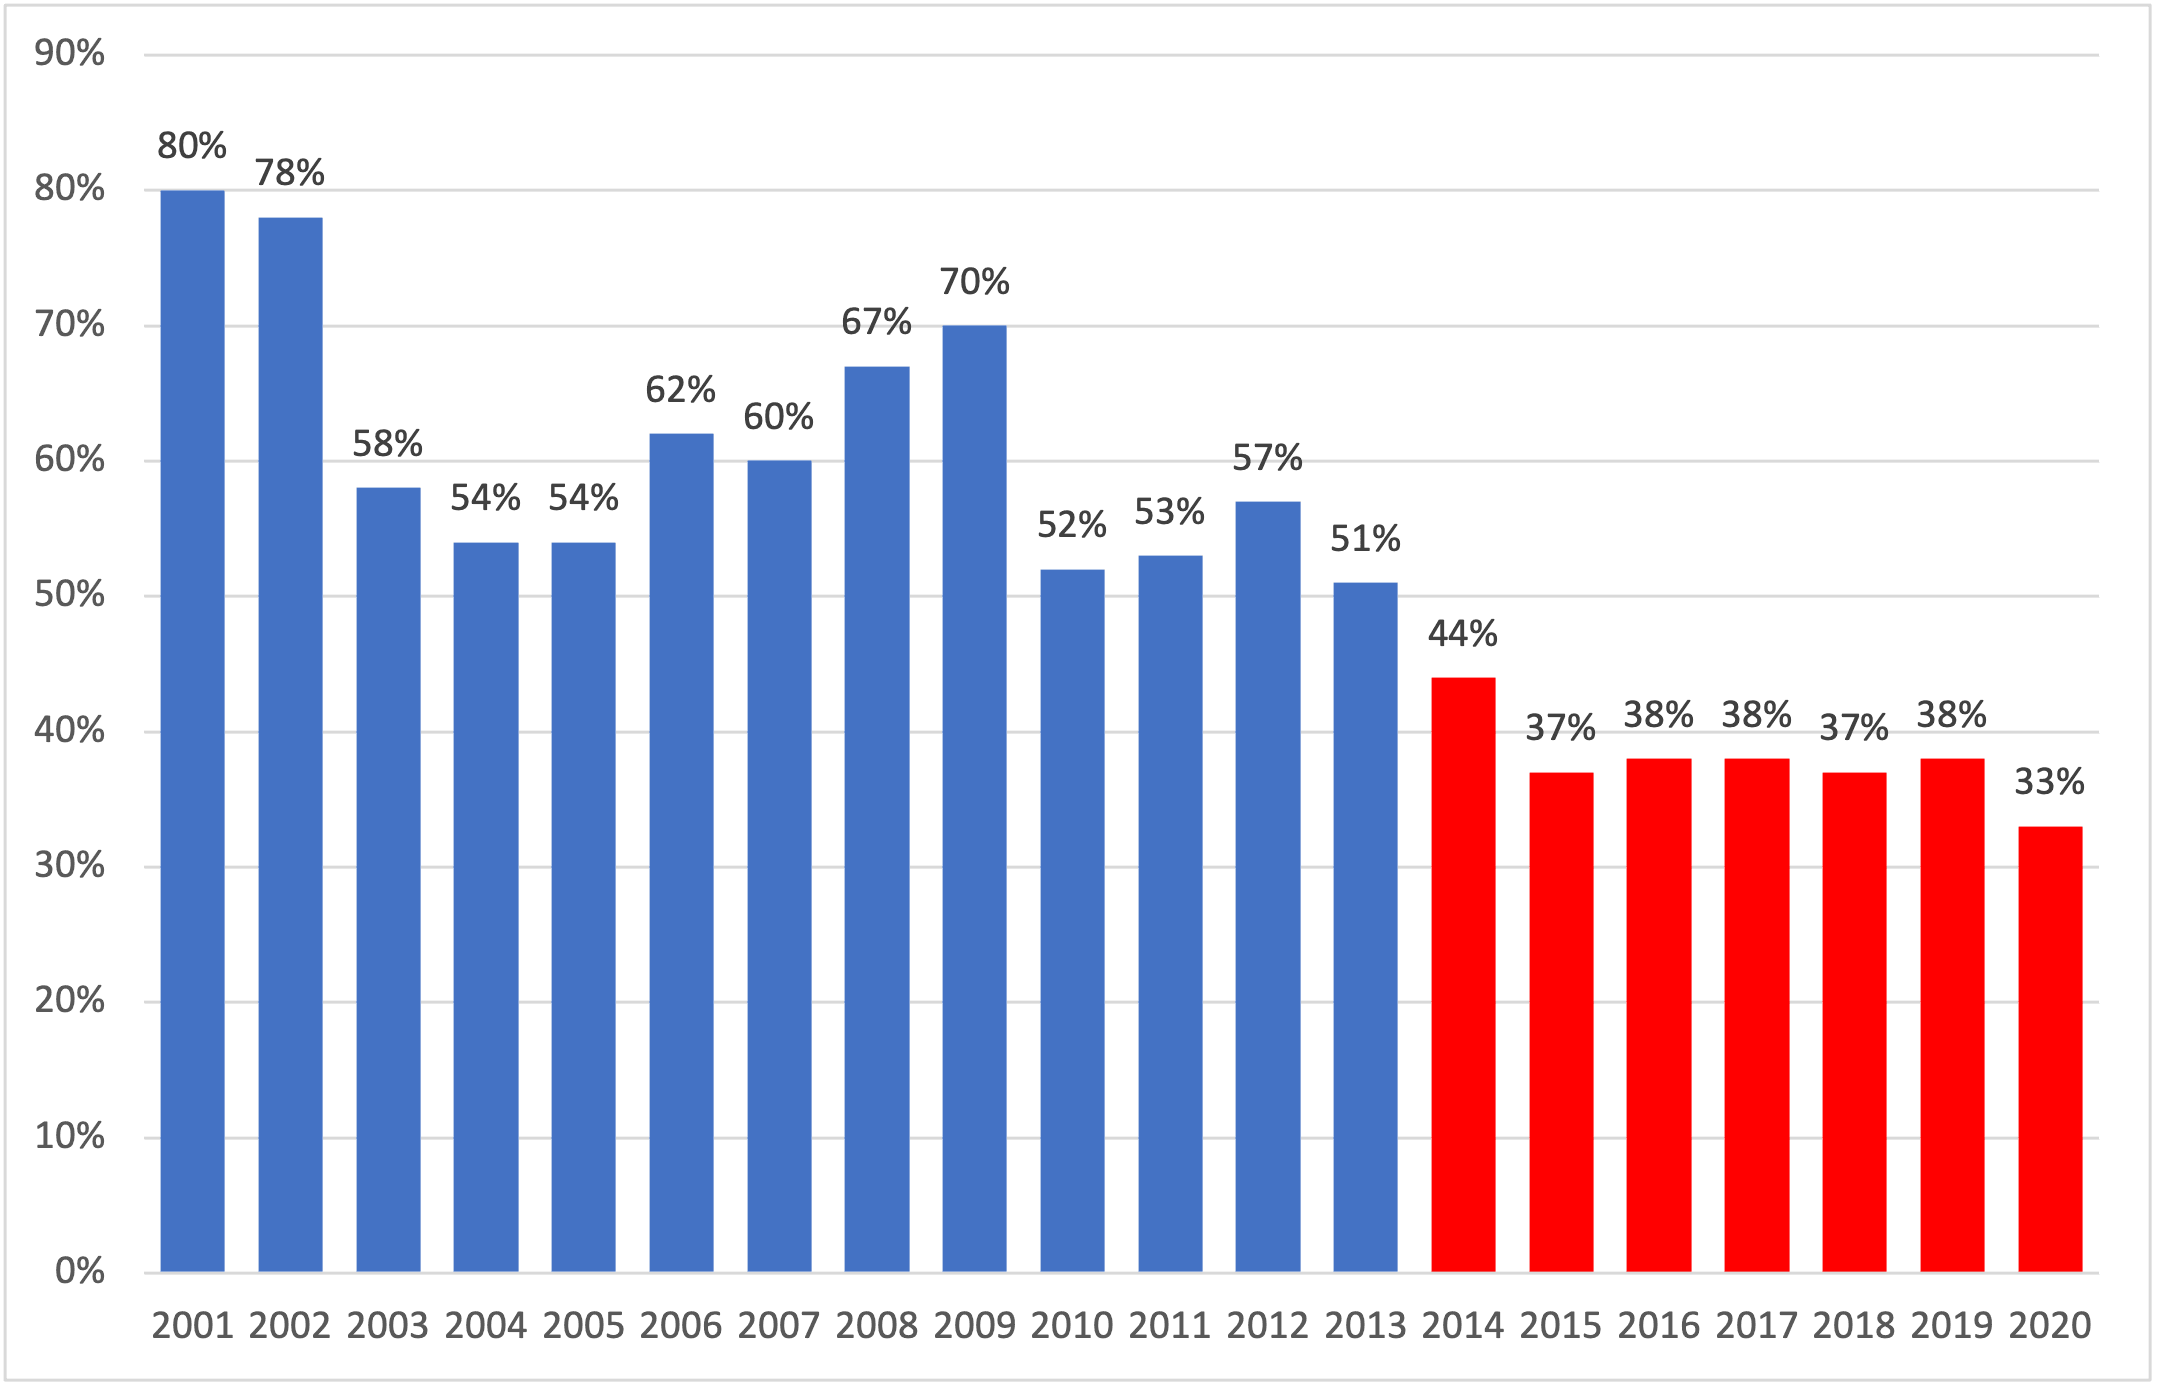
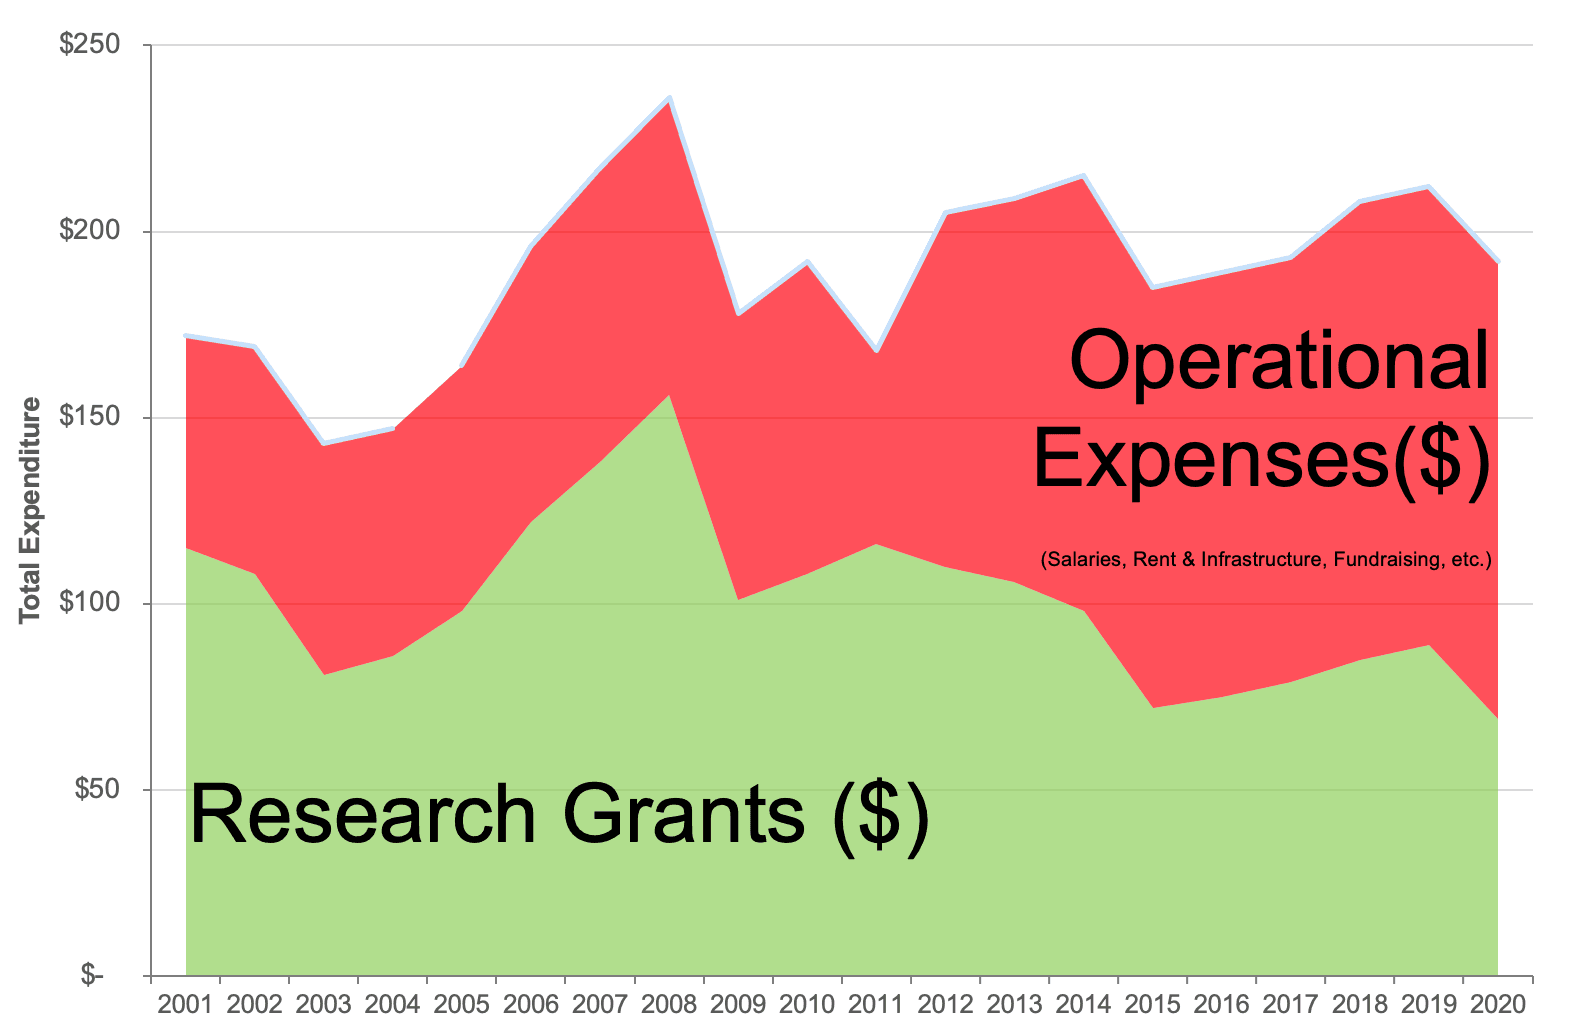
The second-largest functional expense was providing money in the form of grants for T1D research, which was the reason JDRF was founded. During 2020, research grant spending dropped to an unprecedented, 20-year low-point in both absolute dollars and as a percent of revenue.
Research grant spending declined by $20 Million, to 33% of total revenue between FYs 2019 and 2020. During that time frame, JDRF revenue declined by $21 Million dollars, as well. It appears that the decision was made to cover the revenue decline in 2020 by cutting research grant spending; other spending categories remained relatively unscathed.
One challenge to JDCA's coverage of JDRF revenue and expenses in recent years is that the JDRF T1D Fund is under-represented as a source of money for research. While the Fund is indeed innovative and has backed many promising projects, the number of companies supported by the Fund is only a fraction of the research grant spending by the parent JDRF. Later in the year, we will publish a report focused solely on the operations of the JDRF T1D Fund.
Program Expenses
In addition to looking at functional expenses, it is also valuable to examine the programs on which JDRF spent its money. While functional expenses tally up the actual dollars spent – on salaries, for instance – program expenses take a broader view of what those dollars are for. The salary of a manager, for instance, would be a “Management and General” expense.
FY 2020 JDRF Program Expenses
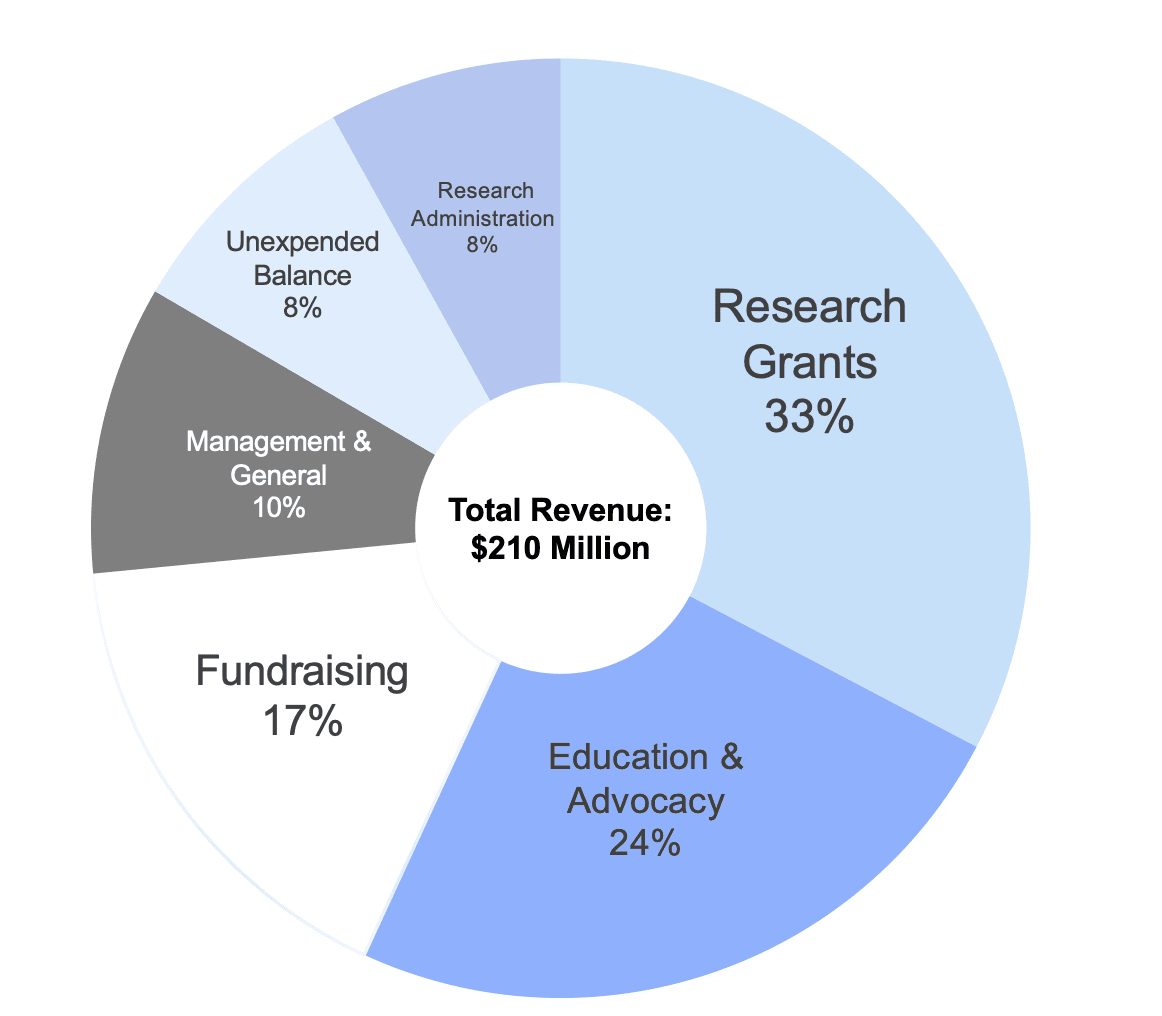
In FY 2020, the only program that increased its budget over the prior year was Fundraising, which increased by $3 Million, or +10%.
JDRF spent $51 Million on Public Education and Advocacy in 2020. According to JDRF, these activities help secure government funding for T1D research. While there is no doubt that government funding of T1D research is essential to the community, it is impossible to objectively assess JDRF's role in securing this funding. It is worth noting that the National Institutes of Health's contribution to T1D research has remained relatively stable over the past decade as JDRF’s Public Education and Advocacy spending has ballooned to 24% of its expenditure.
Would the Juvenile Diabetes Research Foundation of 2001 recognize JDRF in 2021?
Much has changed in 20 years at JDRF: in 2001, the organization was called “The Juvenile Diabetes Research Foundation;” today it is simply known as “JDRF.” Where the name change may hint at a shift in focus away from research, the financial statements state the fact bluntly. Back in FY 2000, the majority of the organization’s resources were used to fund T1D research – nothing else came close. Here are a few comparative highlights which illustrate the 180-degree change in the priorities of the organization since then:
JDRF Key Expense Categories, FY 2000 vs. FY 2020
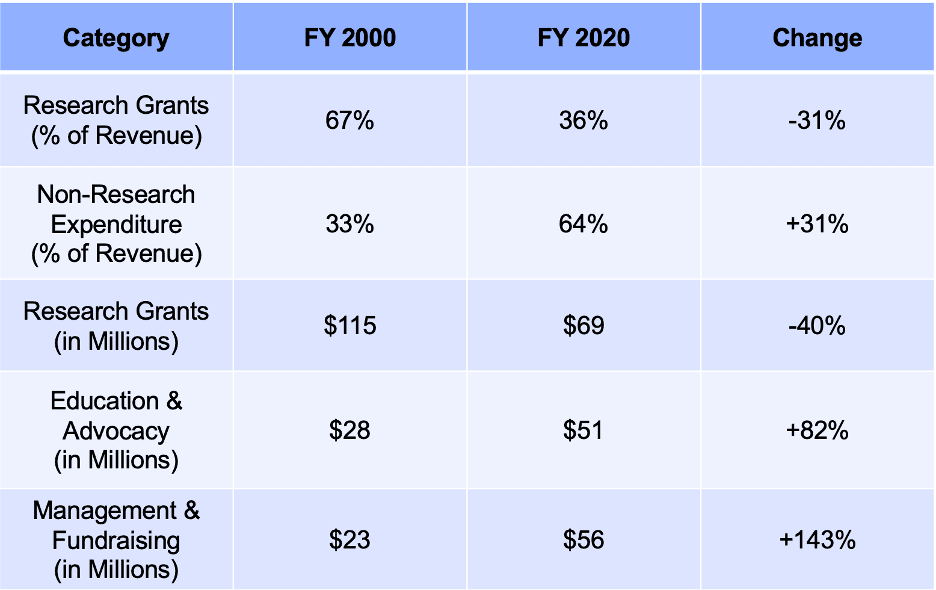
JDRF Research Grant vs. Non Research Grant Spending (as % of Total Expenditure) FY 2000 vs. FY 2020
JDRF Research Grant vs. Non Research Grant Expenses (in Millions) FY 2000 vs. FY 2020