
*2006 was an 18-month fiscal year due to changing from a June 30 fiscal year in 2005 to a calendar year-end in 2006. To represent 2006’s 18-month year in proportion with a 12- month year, all numbers from 2006 are estimates reached by scaling the reported numbers by 2/3.
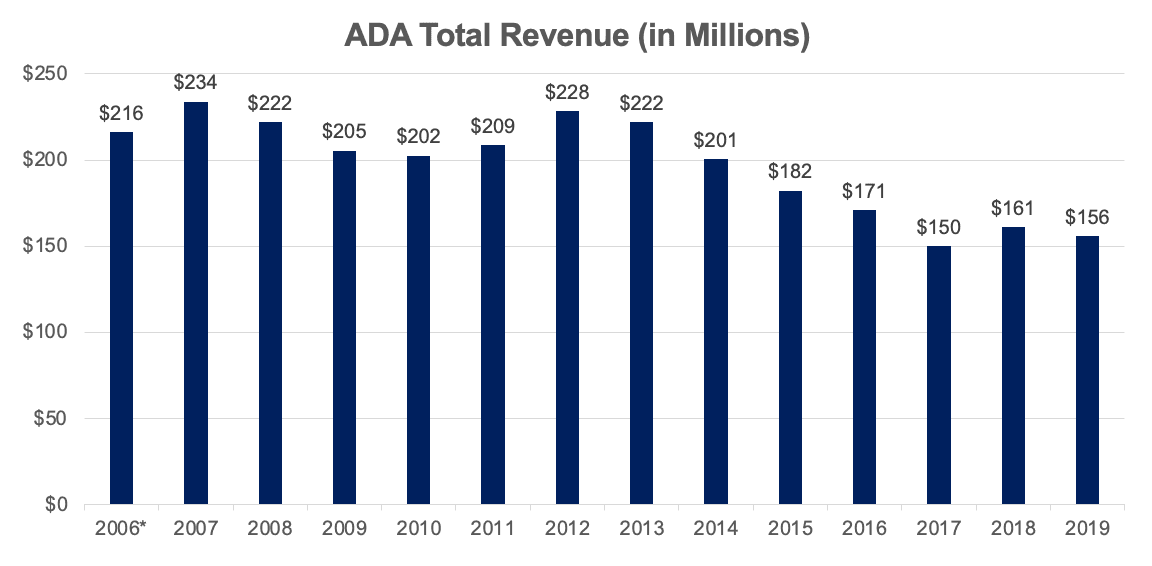
The American Diabetes Association released its 2019 audited financial statements in mid-June. The main takeaway is that the ADA has experienced a historic and sustained decline in revenue from 2006, the first year ADA financial documents are widely available. See the chart above. This report examines the main drivers of the loss in revenue and offers suppositions as to how such a decline could have occurred. A second report will follow in the coming weeks which focuses solely on the ADA’s decline in expenses and spending.
Key Facts and Figures
From 2006 to 2019:
- ADA total revenue was cut by approximately one third, from $216 Million to $156 Million.
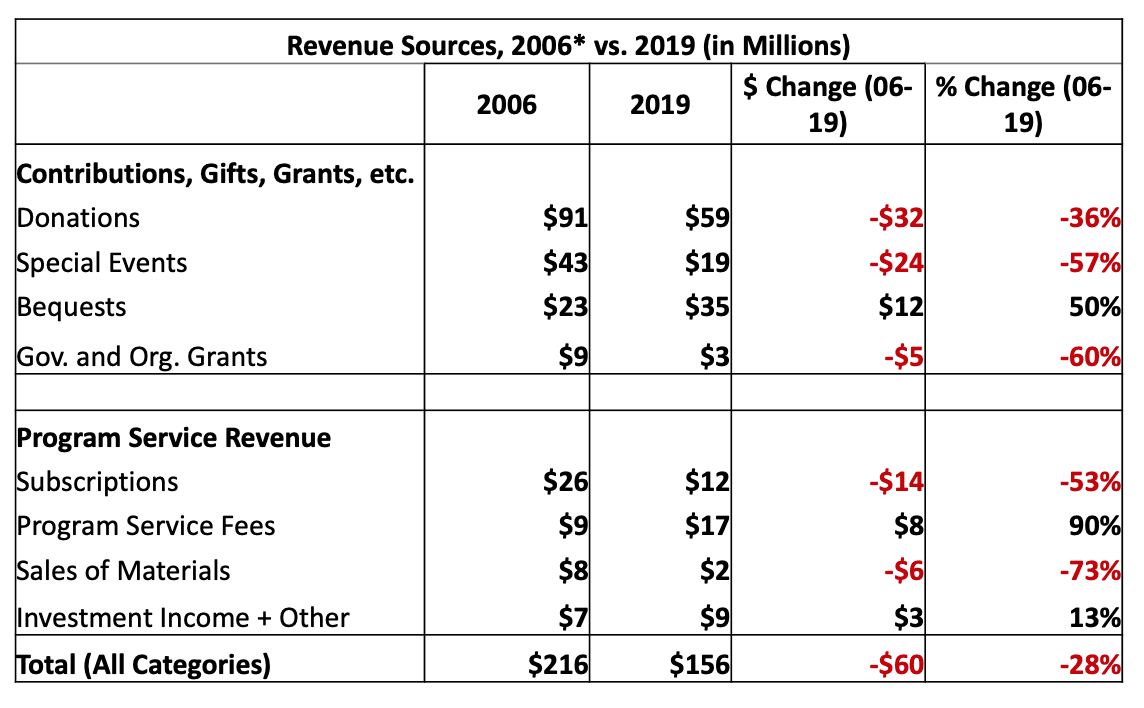
- Almost all other major revenue categories also declined. See chart above.
- 75% of the decline came from the main donor-driven revenue sources: Fundraising Events, Direct Donations, and Bequests.
- 23% came from two paid services: Subscriptions and Sales of Materials.
- A Steep Decline in Revenue = A Steep Decline in Relevance
Almost every revenue-generating activity conducted by the ADA delivered far fewer dollars in 2019 compared to 15 years earlier. With the total number and percentage of people with both T1D and T2D increasing, the obvious question is: how is it possible the ADA experienced such a sizeable reduction in support?
In 2006, the ADA earned approximately $34 Million by selling publications about diabetes and other materials. By 2019, the amount earned from these services dropped by half, to roughly $15 Million. It is not surprising that the rise of digital information sources has directly challenged and negatively impacted publication sales, as it has for many other traditional newspapers and magazines.
However, the most significant losses at the organization came form the revenue it earned from donor contributions – in particular, Donations and Special Event proceeds – dropped $56 Million, a massive decline. In our view, such a decline is indicative of a decrease in relevance resulting from a shrinking donor base.
Although there appear to be a number of contributing factors, the remainder of this report details three driving issues.
1) The ADA Deprioritized Research Spending
From 2006 to 2019 research grant spending dropped 41%, from $45 Million to only $26 Million. This reduction in research support caused the ADA to fall out of alignment with donor priorities: the number one reason that people give money to diabetes charities is to support and fund research which may result in a cure for T1D and/or improve quality of life for people living with the disease.
At the same time, “Management and General” spending (including executive payroll, office management, board meetings, etc.) increased by $3 Million. Said differently, the ADA is spending slightly more today on management and executive payroll as an organization with $160 Million in revenue than it did in 2006 as an organization with a $220 Million revenue.
2) The ADA has Focused on T2D, Pushing Aside the Lucrative T1D Donor Base
The T1D community is an extremely active fundraising enterprise that had previously shown great support for the ADA. In recent years, however, it appears the T1D community has increasingly rallied behind JDRF (who in 2019 tied a record high fundraising year), in lieu of the ADA. Although JDRF research grant spending is down from 67% ($156m) of total JDRF revenue in 2008 to just 38% ($89m) in 2019, compared to the ADA, who in 2019 spent only 2% of their total income on T1D-specific research, it remains the clear charity for those interested in supporting T1D.
3) The ADA's Advertising Promises a Cure but Donations are Not Used for That Purpose
100% of the ADA’s fundraising advertising message featured a promise to fund cure research, a number that has remained consistent over the past 8 prior years. Yet, only 16 percent of the ADA’s annual 2019 income was spent on research and less than 1% of the ADA’s budget was spent on cure-specific research. This misalignment in spending, combined with the use of advertisements that unfairly exploit donors’ passion for finding a T1D cure, appears to have driven donors away.
Conclusion
The decrease in donor engagement, as illustrated by a dramatic decline in donor-driven revenue sources, should serve as a cautionary tale for the other major T1D nonprofits who are currently unaligned with donor priorities. All major diabetes organizations have a moral imperative to spend their income in-line with the priorities of donors, the people not only essential to the continued financial survival of the organizations but progress to eliminating the disease altogether.