The American Diabetes Association released its 2019 audited financial statements last month. This is the third in a series of JDCA reports focused on ADA financials. As noted previously, the ADA has experienced a historic and sustained decline in revenue from 2006, the first year ADA financial documents are widely available. This report examines ADA expenses.
Key Takeaways:
- ADA revenue declined from $216 Million in 2006 to $156 Million in 2019.
- Consequently, all major ADA expense categories, except Management and General, declined from 2006 to 2019.
- ADA Advocacy and Public Awareness spending saw the biggest decline of all categories, declining 53% (-$28 Million) from 2006.
- ADA Research Grant spending is down -42% (-$19) from $45 Million in 2006 to just $26 Million in 2019, matching a 10-year low. See Appendix A.
- Management and General spending (including executive payroll, office management, board meetings, etc.) was the only expense category to increase during this time period. Said differently, the ADA is spending a little bit more on management and executive payroll than it did in 2006, despite spending substantially less on the categories that benefit donors.
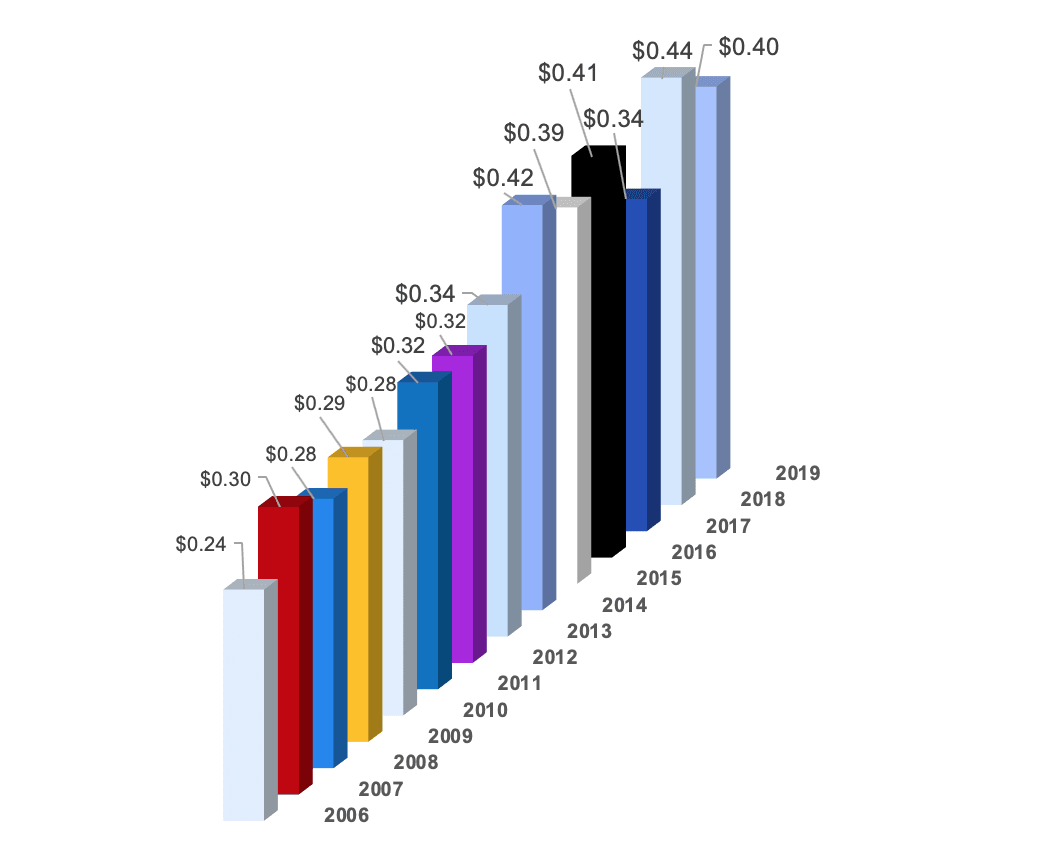
- ADA Internal Costs for Research Administration (expenses related to giving money to research projects) are up from $0.24 in 2006 to $0.40 in 2019. This means the ADA is spending almost twice as much to give out half the amount of research grants it did in 2006. See Appendix B.
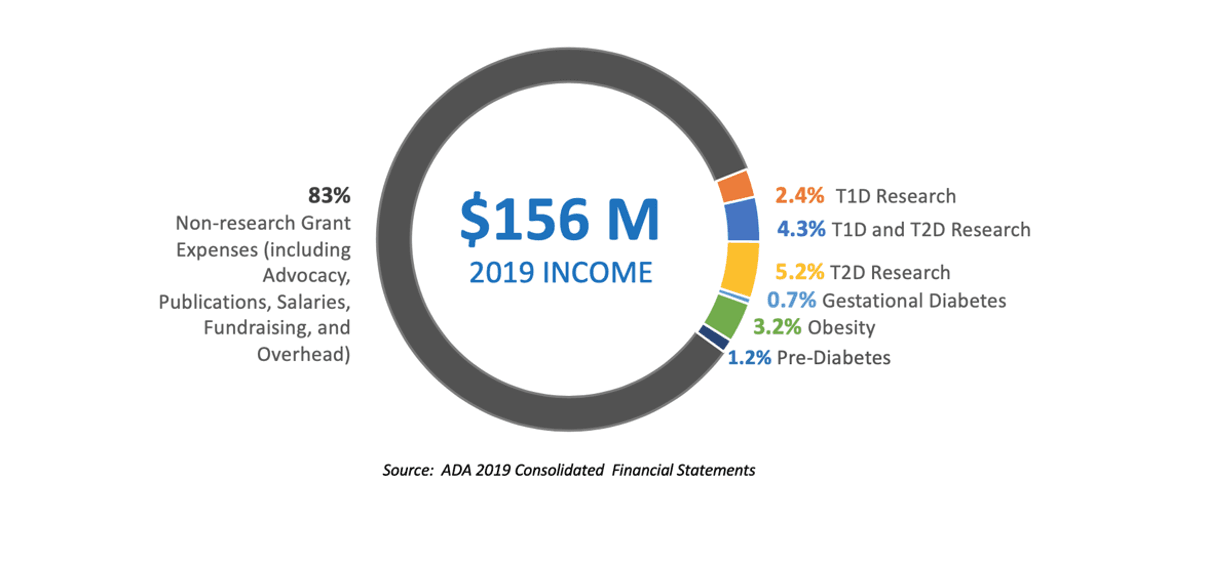
- Of the $26m attributed to research grants, only $3.4m went to grants specifically focused on T1D. See Appendix C.
- Despite spending only 17% of its total income on research grants, 100% of ADA advertising featured a message related to curing diabetes in 2019.
Appendix A: ADA Total Research Grant Spending by Year
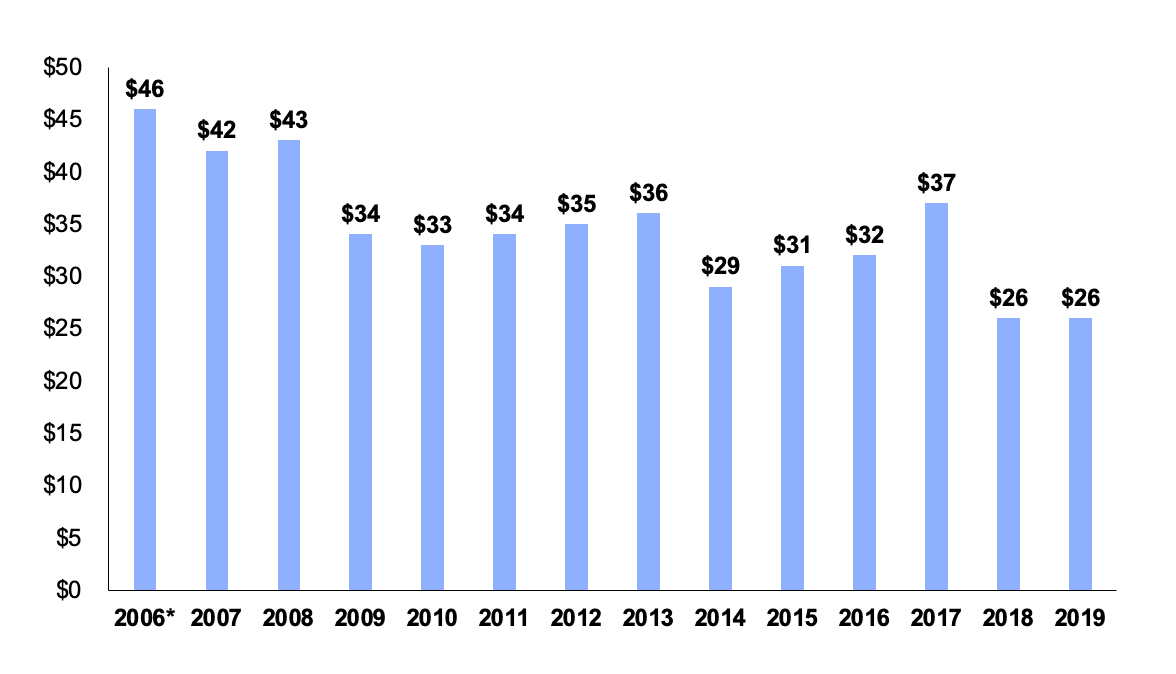
*2006 was an 18-month fiscal year due to changing from a June 30 fiscal year in 2005 to a calendar year-end in 2006. To represent 2006’s 18-month year in
proportion with a 12- month year, all numbers from 2006 are estimates reached by scaling the reported numbers by 2/3.
Appendix B: ADA Research Administration Costs by Year
Appendix C: ADA Utilization of 2019 Annual Income Highlighting Research Grant Categories