Summary
- JDRF is a powerhouse fundraising organization with nearly all its money coming from fundraising events and donations.
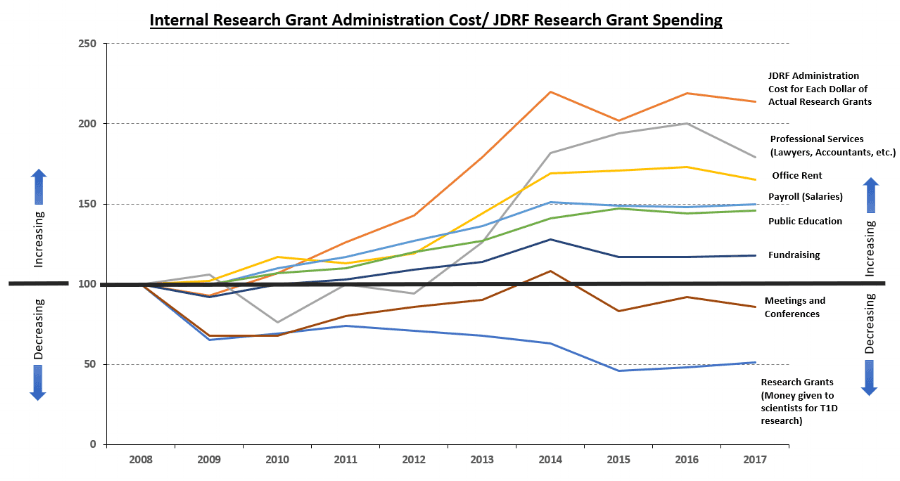
- JDRF research grant spending has remained at historically low levels for three consecutive years. In 2017, only 38 percent of all income was used for research grants (e.g., money given to scientists for T1D research), as compared to 67 percent ten years ago in 2008.
- Research grant spending has also declined $77.4 million from ten years ago. All other main spending categories have increased.
- If JDRF had invested the majority (i.e. 51% percent) of fundraising proceeds into T1D research over the past five years, the result would have been an increase of an additional $100 million.
This report analyzes the key sources of income for JDRF and the primary ways this money was used during 2017. All data is sourced directly from JDRF financial statements which are publically available on the JDRF website. (Click here to view)
The main takeaway from this year’s report is that research grant spending remains at a ten-year low while all other principle spending categories increased. We continue to believe that JDRF is likely the best-positioned entity in the world to bring fundamental change to people living with type 1 diabetes; however, their current research grant spending decline is a cause for concern and raises a key question about organizational priorities.
The following are highlights from our review of JDRF income and spending:
Income:
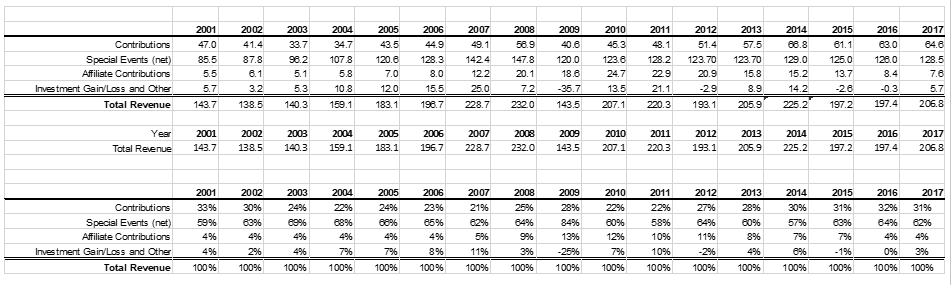
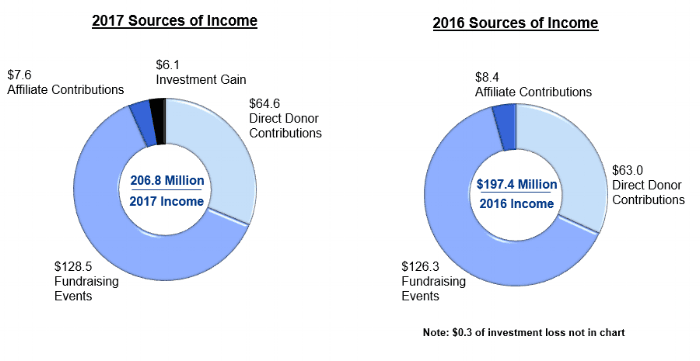
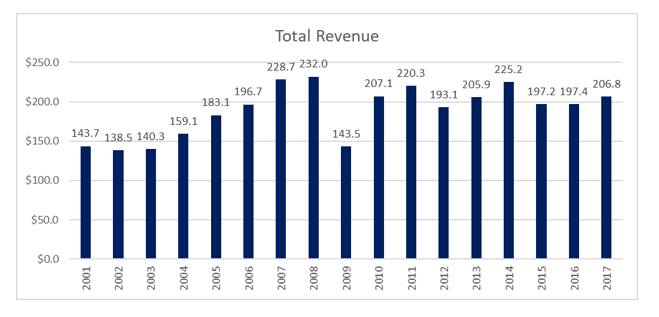
- Total income increased from $197.4 million in 2016 to $206.8 million in 2017.
- Donor contributions provided nearly 100 percent of JDRF income:
- 62% was raised through fundraising events.
- 31% was raised through direct donor contributions.
- 4% was raised from international affiliate contributions.
- 3% was attributed to investment gain.
See Appendix A for income sources by year.
Spending:
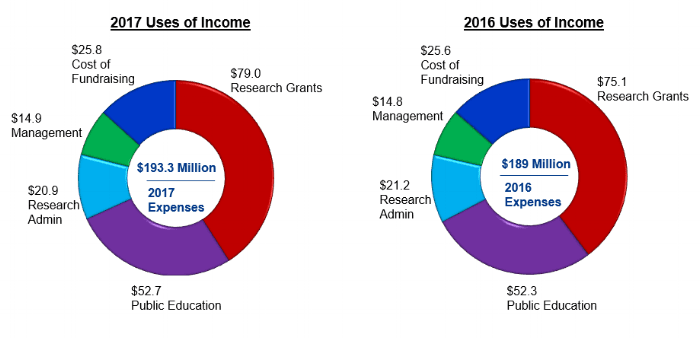
- JDRF total spending (expenses) increased from $189 million in 2016 to $193.3 million in 2017.
- Research grant spending recorded a small increase from the prior year but remains at record-low levels. While grant spending increased from $75.1 to $79 million between 2016 and 2017, it is still $31 million less than five years ago in 2012 and $77 million less than ten years ago in 2008 when research grant funding reached $156 million.
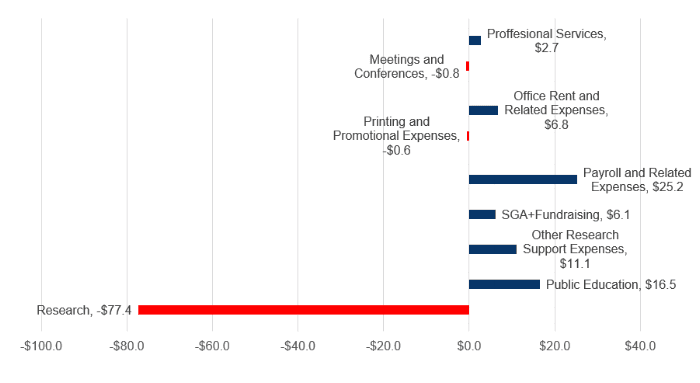
- All other principle non-research costs have increased in recent years as shown in the chart below:
- Payroll and Related Expenses have increased by $25.2 million since 2008, up 50%. Payroll increase is well ahead of inflation— a cost increase for a return that is not yet evident.
- Public Education expenses have increased $16.5 million since 2008, up 46%.
Spending Increase/Decrease by Category Indexed to 2008
2008 vs. 2017 Annual Spending Change (In millions)
Conclusion:
Donor surveys conducted by the JDCA over the past five years consistently demonstrate that the number one reason people make a donation or participate in a fundraising event is to support research. As JDRF is fully supported by individual outside donors, the JDCA believes the spending agenda should match the core wishes of its donor base. Consequently, we believe increases in internal operating costs require a clear explanation, as there is not yet an obvious and transparent return on this investment for donors.
Appendix A1: Total JDRF Revenue by Year in Millions
Appendix A2: Annual Revenue Trends by Category In Millions